

When we talk to operators we ask them “how many items on your menu are “popular”… and still stealing money from you?”. Most owners don’t worry about low-margin restaurant menu items. Big mistake.
At RevenueHawk, we see this playing over and over. Operators chase sales. They keep adding more items to please one more guest. Then food cost creeps up, prep gets complicated, waste explodes, and the kitchen turns into a profit-killing mess.
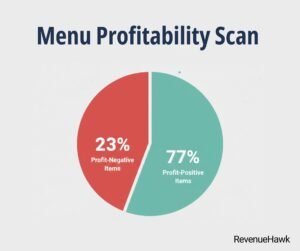
In our 2025 Menu Profitability Scan (312 restaurants, 4,812 menu items), 23% of items were profit-negative once we included comped remakes, waste, and the extra prep labor they trigger. The wild part: most of those items looked fine on paper because the recipe cost seemed close. They weren’t close. They were quietly leaking.
That’s why this guide doesn’t just tell you to kill the losers. It gives you a full system. Because low-margin items usually aren’t the real problem. They’re a warning sign of a bigger mess: sloppy portions, old recipes, bad buying specs, weak inventory habits, and prices that never kept up with costs.
For more on the key factors driving this pain in 2026, check National Restaurant Association’s 2026 outlook.
And if you’re serious about controlling cost this year, start by treating your menu like a portfolio. Cut the dead weight. Rebuild around repeatable winners. That’s the mindset behind our food-cost optimization guide — because cutting items without fixing the system just creates new losers later.
So let’s do this the clean way: identify the losers fast, remove them without breaking the guest experience, and lock in the systems so your best items stay profitable.

KEY POINTS: WHAT YOU’LL LEARN
- Step-by-step: How a simple audit turns your menu into a ranked list: keep, fix, or kill.
- Why this matters: The real reason why just raising prices is failing in 2026.
- Case Study: A known-brand style turnaround: fewer items, faster line, higher margin.
- Mistakes: Five traps that keep operators stuck with loser items.
- Metrics: The formulas that stop debates and force clarity.
- Make it last: A consistency checklist so your menu doesn’t drift back into chaos.
- The reset you need: The beliefs that separate profitable operators from busy ones.
- Action Plan: A 30-day schedule you can actually execute.
Quick note: if your team wants a framework to rank menu items, use our full menu engineering guide. For this guide, we’ll keep it simple and practical.
WHY THIS MATTERS
It’s pretty clear to many that the industry is walking a tightrope in 2026: guests are cautious, but costs are still climbing.
Here’s what changed:
- Food away from home inflation is still real: BLS shows food-away-from-home prices rose 4.1% from Dec 2024 to Dec 2025.
- Dining-out prices aren’t cooling off in 2026: USDA forecasts food-away-from-home up 4.6%.
- Menu price increases aren’t free:NRN’s coverage shows menu pricing is still rising and guest price sensitivity is rising too.
Big brands are reacting with systems, not vibes. They simplify menus, push high-margin bundles, engineer offerings that travel well, and protect throughput. You can see how the value war is evolving beyond discounts in fast casual coverage heading into 2026.
What doesn’t work anymore:
- Price hikes as the whole plan. (That hits your softest traffic first.)
- Specials without knowing margins. (You’ll accidentally push low-profit items.)
- Labor cuts as a reflex. (You’ll bottleneck the line and bleed sales.)
What we see operators missing again and again is painfully simple: your menu is the control panel for food, labor, waste, speed, and guest satisfaction. If it’s full of losers, every other fix becomes harder.
That’s why we use a 15-point weekly food-cost checklist mentality: small checks, every week, so problems don’t become emergencies.
STEP-BY-STEP: HOW TO IDENTIFY AND REMOVE LOW-MARGIN RESTAURANT MENU ITEMS
To kill low-margin items without breaking your operation, we use a 4-step audit: (Step 1) get true item profit, (Step 2) separate margin from popularity, (Step 3) find the why behind each loser, and (Step 4) execute cuts and fixes in the right order.
How to get true profit per menu item?
Most restaurants calculate item cost like this: ingredients, maybe a garnish and call it done. That’s how losers survive.
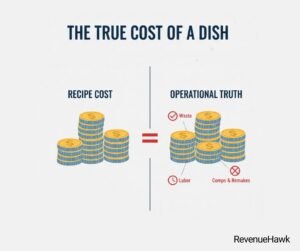
True profit needs three upgrades:
- Recipe-level truth (real yields, real portions, real waste).
- Purchase-spec truth (the product you actually receive, not the one you wish you received).
- Operational truth (remakes, comps, station complexity, and the prep time nobody tracks).
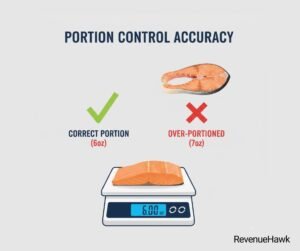
If your recipe costs are even a little sloppy, you’ll rank items wrong. Start with accurate recipe costing. The fastest operator proof method we like: pull the recipe card, weigh the portion duringservice, and compare it to spec. If it’s off by 10%, your margin map is fiction.
RevenueHawk pattern: when restaurants think they have a few portion issues, our audits usually find 12–18 items with uncontrolled portions. And the biggest leaks are almost always the same: proteins, cheese, fries, and sauces.
We advise operatots to use this rule: if an item’s margin is thin, the execution must be tight.
A McKinsey report shows the gap between restaurant menu price increases and grocery price increases — and how that gap squeezes operators.
How to separate popular from profitable?
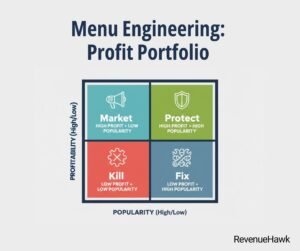
You need a simple grid:
- High profit & high sales = Protect these
- High profit & low sales = Market these
- Low profit & high sales = Fix these (or they’ll drain you)
- Low profit & low sales = Kill these
The biggest trap for operators is usually the third box: the fan favorite that’s stealing margin. Fixing those requires portion control first—not price changes first.
That’s why we obsess over stop over-portioning systems. Because a 0.8 oz extra protein portion doesn’t feel like much… until it happens 1,200 times a month.
If your line cooks are free-pouring anything expensive, your menu isn’t engineered — your menu is gambling.
How to fix losers without raising prices first?
Don’t start with price increases. Start by cutting cost and cleaning up friction. Then, if you still need it, raise prices.
Three fixes beat price hikes most of the time:
Fix A: Reduce unit cost.
If your chicken breast price jumps and you panic-price the item, you’ll lose the value guest. Instead, tighten specs, re-bid, consolidate vendors, and negotiate from volume and consistency. That’s the core of our supplier negotiation playbook.
Fix B: Reduce waste and shrink.
If you have an unexplained mystery loss, your margin report lies. A $200/week theft/waste leak turns your okay item into a loser. Install a loss-prevention shield — camera placement, transfer logs, line checks, and tight receiving discipline.
Fix C: Reduce complexity cost.
Some items cost you in time, not ingredients. If an item adds a unique sauce, unique prep step, unique garnish, and unique holding time, it quietly increases labor and slows throughput.
Want to understand why operators are being forced into tighter execution? Restaurant Dive breaks down the cost pressures—tariffs, cost surges, and more.
When to kill an item vs. redesign it?
Kill an item when:
- It has low sales and low profit.
- It creates unique inventory you can’t cross-use.
- It causes service problems (ticket times, remakes, station overload).
- It’s a brand distraction (your menu has no center).
Redesign it when:
- People love it.
- It has a clear role (signature, upsell anchor, bundle builder).
- You can fix it with portion, spec, or prep system.
This is where recipe engineering for profit matters. We’re not talking about ruining quality. We’re talking about smart design:
- Swap one expensive garnish for a cheaper high-perceived-value garnish.
- Standardize sauces so 4 items share 2 sauces.
- Use trim and cross-utilization so one prep batch feeds multiple dishes.
The NRA culinary forecast is a solid signal source if you want a reality check on what guests are craving—and what they’ll pay for — going into 2026.
CASE STUDY: A REAL EXAMPLE (MEXICAN GRILL)
Restaurant Type
Sports bar / wings and burgers
Location
Midwest U.S.
Seats
140
Problem Identified
18-item menu long tail doing 6% of sales but driving 22% of waste and most ticket-time spikes.
What Was Implemented
- Killed 9 low-sellers that required unique SKUs
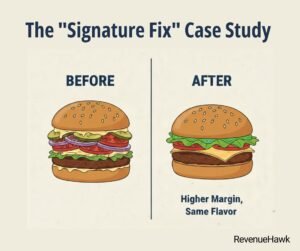
- Redesigned 6 fan favorites with tighter portions and shared sauces
- Installed a batch-prep system for sauces and proteins (same batch sizes, same labeling, same hold times)
- Re-priced only 4 items after fixing cost structure, using step pricing (small increases, not giant jumps)
Results
- Food cost down 2.4 percentage points in 6 weeks
- Ticket times down 11% at peak
- Waste (measured by key-item variance) down about 18%
- Guest complaints didn’t increase — because we removed clutter, not value
If you’re thinking about raising prices — yes, do it eventually. But do it like a surgeon, not a firefighter. That’s the mindset behind raise prices without losing guests: fix the economics first, then adjust pricing with care.
This Restaurant Dive piece is a good snapshot from late 2025 of how price fatigue shows up in real menu-item tracking (burgers, burritos, beer, etc.).
KEY MISTAKES
1. You can’t market your way out of bad margins.
If the item is a loser, selling more loses faster.
2. Cutting items without cutting SKUs is fake work.
If the inventory stays, waste stays.
3. Ignoring shrink makes your reports fantasy.
Fix the back door before you redesign the front menu.
4. Panic changes create chaos.
Without a plan for sudden rushes, the kitchen gets slammed and confused. Use a spike-fix protocol — what to lock, what to re-bid, what to pause, and what to swap.
5. If cooks are eyeballing high-cost items, portions aren’t controlled.
They’re guesses. And guesses don’t scale.
METRICS: THE NUMBERS THAT MATTER
If you don’t measure these, you will keep losers by accident.
Food Cost %
Food Cost % = COGS / Food Sales
Prime Cost % (context)
Prime Cost % = (COGS + Labor) / Sales
Contribution Margin (Item $)
Contribution Margin (Item $) = Menu Price − Plate Cost
Contribution Margin (Item %)
Contribution Margin (Item %) = (Menu Price − Plate Cost) / Menu Price
Menu Mix %
Menu Mix % = Item Sales / Total Sales
True Plate Cost
True Plate Cost = (Recipe cost adjusted for yield + average waste + average remake/comp impact)
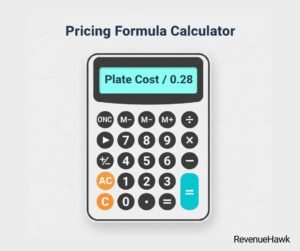
If you want prices to make sense, set a goal and follow a simple process. The simplest operator method is the 28% food-cost pricing formula: Menu Price = Plate Cost / 0.28 (Adjust the target if your concept needs 30–33% or if labor is heavier.)
And don’t ignore beverages. They’re often the simplest margin win: low labor, high perceived value. Track beverage-cost percentage the same way you track food cost — weekly, not when someone has time.
So here’s the must-do: weekly food-cost tracking. You don’t need fancy tools. You need consistency: same day, same time, same counts, same variance review.
![]()
HOW TO MAKE IT LAST
Killing losers is a one-time project. Keeping them dead is the system you need.
Use this checklist:
- Receiving done with specs in hand (not memory)
- Random weigh-backs on expensive portions during service
- Prep labels with batch date and discard time
- One weekly variance meeting
- A menu change gate: no new item without cost card and station impact review
- A SKUs report: any ingredient used in only 1 item is guilty until proven innocent
- Daily line checks for top 10 high-cost items
Here’s how we advise operators to win: build small inventory habits into every day. Strong kitchens don’t count only when they get time. They do quick checks that prevent big misses.
THE RESET YOU NEED
- Your menu isn’t a cookbook. It’s a tool to make money.
- More items aren’t “better” if they slow service and make food inconsistent.
- Most high food cost comes from broken systems, not bad luck.
- Don’t debate pricing until you agree on the real plate cost.
- A smaller menu, executed well, will beat a big menu that leaks profit every day.
Here’s an easy rule: every item on the menu has to help. It must make good profit, be fast to make, or fit your brand. If it does none of those, cut it.
ACTION PLAN: WHAT TO DO NEXT
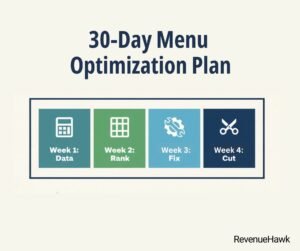
Here’s what to do over the next 30 days as follows: (Week 1) collect real sales and recipe data, (Week 2) rank items and diagnose losers, (Week 3) execute the fixes (portion/spec/prep), and (Week 4) cut the dead weight and retrain the line.
How do I prepare my data fast?
Pull:
- 8–12 weeks of item sales
- Current recipes (even if messy)
- Latest invoices for top 30 ingredients
Don’t wait for perfection. You’re looking for direction.
How to rank items into keep/fix/kill?
Build the grid:
- Profit per item (true plate cost)
- Mix (how often it sells)
Then label:
- Protect
- Market
- Fix
- Kill
What fixes to execute first?
Order matters:
- Portion controls for expensive items
- Vendor/spec resets on top proteins
- Prep simplification and cross-use sauces
- Waste/shrink controls at receiving and storage
How to remove items without upsetting guests?
- Don’t announce that you’re cutting items. Just improve the menu.
- Replace losers with better versions of what guests already love.
- Give servers this script: “We made the menu simpler and doubled down on our best dishes.”
And if you’re wondering what to remove first, start with what causes the most pain. In our audits, the pain list is usually the same as the profit leaks list: items with unique SKUs, long prep, and inconsistent portions.
FREQUENTLY ASKED QUESTIONS (FAQ)
1) How many items should I cut?
We see most restaurant menus can be cut by 10–20% without hurting the guest experience — if you remove the rarely ordered items and keep the favorites.
2) What if my signature item is a low-margin loser?
Redesign it before you kill it. Tighten portions, re-spec ingredients, and simplify garnish. Keep the signature, remove the leak.
3) Should I raise prices or cut items first?
Cut/fix first. If you raise prices on a broken cost structure, you’ll just keep losing — at a higher price.
4) How fast will I see results?
If you do it right: portion changes show up in a few days, waste changes show up in a few weeks, and menu changes take about a month.
FINAL THOUGHTS
Here’s the key takeaway: most owners don’t have a menu problem. They have a truth problem. They don’t know what makes money. They don’t know what slows the kitchen down. They don’t know where food gets wasted. So they keep everything — and profit stays small. Remove the weak items. Fix the system behind the waste. Then protect the best items, because they pay the bills.
This is only part of our Restaurant Growth Engine. It connects menu, pricing, labor, buying, and operations so you stop guessing and start growing profit.