

Do you know how to calculate beverage cost percentage the right way?
Here’s the pattern we see over and over: restaurants don’t have a beverage cost problem. They have a counting problem.
When we run diagnostics across operations, the underperforming restaurants usually do one of two things:
- They don’t calculate beverage cost at all (so every decision is a guess).
- Or they calculate it monthly (so they find the leak after the money is already gone).
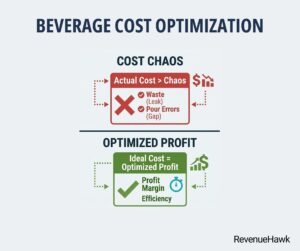
Here’s why we like beverage cost as a margin lever at RevenueHawk: it’s the easiest place to find money you’re already earning and then losing. It’s the perfect storm of small leaks: free pours, loose portion control, missed rings, comps, and sloppy inventory. And in 2026, when food-away-from-home inflation is still projected to rise faster than its long-run average, you don’t get to ignore leaks anymore.
This is why we treat beverage cost as part of the bigger system — the same system we lay out in our food-cost optimization guide. If you can’t measure it cleanly, you can’t fix it.
RevenueHawk Insight: Our audit data shows most operators weren’t underpriced. They were leaking margin. Their real beverage cost ran 3–6 points higher than it should because of heavy pours, comps that weren’t tracked, and inventory drift. The top operators didn’t work harder. They just installed tighter systems.

KEY POINTS: WHAT YOU’LL LEARN
- Step-by-step how to calculate beverage cost percentage: The exact math (and the exact setup) to calculate beverage cost without fooling yourself.
- Why this matters: Why beverage cost control is more important in 2025–2026 than it was pre-inflation.
- Case Study: A practical example showing how a bar program goes from “mystery losses” to controlled margins.
- What to avoid: Five mistakes that make your numbers useless.
- Metrics: The formulas that actually drive action (not vanity reporting).
- Make it last: Simple weekly routines that keep cost from snapping back.
- The reset you need: The belief change that separates operators who win from operators who cope.
- Action Plan: A 30-day schedule you can run without needing new software.
WHY THIS MATTERS
Beverages are becoming a bigger strategy lever in 2026 — premium caffeine, mocktails, energy drinks, destination beverages. Operators are investing here because drinks can lift check average without adding kitchen complexity. Restaurant Dive called out 2026’s push toward mocktails, energy drinks, and premium caffeine innovation (and operators spending more on beverage innovation).
But here’s a key point: the more you push beverages, the more expensive it becomes to be sloppy.
And unfortunately, inflation isn’t cutting you any slack. According to FRED, the wholesale cost of essential kitchen ingredients remains near historic highs, forcing restaurants to navigate a ‘new normal’ of elevated operating expenses and adjusted menu pricing. BLS CPI data about food away from home prices just confirms that.
So why do traditional solutions fail?
- They chase price, not process. Saving 2% on vodka does nothing if bartenders overpour 6%.
- They measure too late. Monthly beverage cost is like weighing yourself once a year.
- They ignore the system. Beverage cost is connected to menu design, training, theft controls, ring discipline, and inventory accuracy — aka the real hidden profit killers.
Also: beverage demand is evolving. Restaurant Dive pointed out that adult beverages keep driving check averages in casual dining visits.
If your beverage cost is a little high, don’t ignore it. Fix it now — before the next sudden cost spike turns into a permanent margin haircut.
STEP-BY-STEP: HOW TO CALCULATE BEVERAGE COST PERCENTAGE THE RIGHT WAY
To turn beverage sales into beverage profit, we use a 4-step audit: (Step 1) define what counts as beverage cost and what counts as beverage sales, (Step 2) calculate actual beverage cost using inventory math, (Step 3) calculate ideal beverage cost using recipes and standard pours, and (Step 4) measure the gap weekly and fix the leak in sequence.
How to define beverage cost (COGS) the right way?
Start by deciding what lives in beverage COGS. Most restaurants should include:
- Alcohol: beer, wine, spirits, liqueurs
- NA beverages: soda syrup, coffee, tea, juice, energy drinks, bottled drinks
- Mixers and bar ingredients: tonic, sour mix, syrups, bitters, garnishes (lime/lemon), purees
Don’t quietly mix in paper goods (straws, napkins, cups) unless you’re consistent and you want beverage cost to include disposables. Most operators track those separately.
This is where we see many operators mess up: invoices get coded wrong, and you fix a cost problem that’s actually an accounting bucket problem.
How to define beverage sales so the percentage means something?
Pick one:
- Gross beverage sales (simple, but ignores discounts/promos)
- Net beverage sales (recommended: subtract discounts; reflect reality)
If you run heavy promos (happy hour, BOGO), use net sales. Otherwise, you’ll blame the bartender for your promo.
How to calculate actual beverage cost percentage (the number that hits your P&L)?
Use the inventory equation for the time period (weekly is best; monthly is tolerable; daily is overkill for most):
Actual Beverage COGS = Beginning Inventory + Purchases − Ending Inventory (± Transfers)
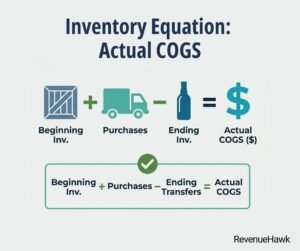
Then:
Actual Beverage Cost % = Actual Beverage COGS / Beverage Sales
If you’re currently doing this monthly, stop. It’s a waste of time. You don’t need a perfect month-end report — you need a fast weekly steering wheel. Learn how to do weekly cost tracking.
Here’s a quick example (weekly):
- Beginning inventory: 8,000
- Purchases: 2,500
- Ending inventory: 7,200
- Beverage sales: 14,000
Actual COGS = 8,000 + 2,500 − 7,200 = 3,300
Actual cost % = 3,300 / 14,000 = 23.6%
How to calculate ideal beverage cost (so you know what good looks like)?
Actual tells you what happened. Ideal tells you what should have happened if every drink was made exactly to spec.
Ideal beverage cost comes from:
- Standard pour specs (e.g., 1.5 oz spirit)
- Accurate recipes
- POS mix (how many of each drink sold)
This is why recipe costing discipline is so important. And it’s not a chef thing — it’s a profit thing.
How to measure the variance (the only number that drives action)?
Variance (points) = Actual Cost % − Ideal Cost %
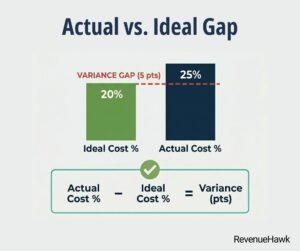
If ideal is 20% and actual is 25%, you’re not just a bit high. You’re actually bleeding 5 percentage points.
Then you diagnose where it comes from:
- Overpouring / inconsistent builds
- Unrung drinks / comps / friends
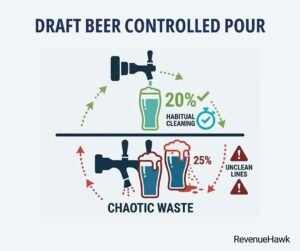
- Draft beer loss (foam, line waste)
- Spoilage (juices, fresh garnish)
- Inventory counting errors
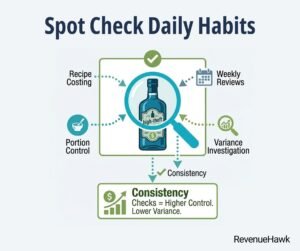
How to keep inventory from becoming a nightmare?
What we advise operators is not to count more, but to count smarter.
You should adopt a few key daily inventory habits for the high-risk stuff:
- Open bottles behind the bar
- Draft keg levels
- High-theft spirits
- High-velocity NA items (coffee, syrup, energy drinks)
Do quick spot counts daily, and a full count weekly. That keeps your weekly cost number trustworthy.
CASE STUDY: BUFFALO WILD WINGS-STYLE SPORTS BAR
Restaurant Type
High-volume sports bar with full bar and drafts
Location
Midwest U.S. suburb
Seats
150
Problem Identified
Beverage cost reported at 29% monthly, but managers couldn’t explain why.
What Was Implemented
- Weekly inventory and invoice coding cleanup
- Standard pour training and jigger policy on top 10 cocktails
- Tight comp controls and manager-only void approval
- Draft beer loss tracking (line cleaning schedule and pour checks)
Results
- Actual beverage cost down by 4 percentage points in 6 weeks
- Variance gap shrank by more than half
- Biggest found money came from controlling comps and pours, not price changes
What fixed the problem wasn’t better bartenders. It was systems:
- stop over-portioning systems do apply to bars too — overpouring is just over-portioning in liquid form.
- And tighter loss-prevention for waste and theft stopped the invisible leak: free drinks that never hit the POS.
KEY MISTAKES
- If you count once a month, you’re choosing to stay blind.
- If you don’t define beverage COGS, your percent is a random number.
- If your recipes aren’t costed, ideal doesn’t exist.
- If managers can comp freely, your POS data can’t be trusted.
- If you chase cheaper suppliers before fixing pour control, you’re optimizing the wrong thing.
This is why we recommend a simple weekly cost audit checklist: same rhythm, every week, no chaos.
And yes — supplier savings matter, but only after you plug the leaks. Use our supplier negotiation tactics playbook once your internal controls stop turning savings into waste.
METRICS: THE NUMBERS THAT MATTER
Here are the metrics we actually use in audits (simple, but deadly effective):
Beverage Cost %
Beverage Cost % = Beverage COGS / Beverage Sales
Actual Beverage COGS
Actual Beverage COGS = Begin Inv + Purchases − End Inv (± Transfers)
Ideal Beverage Cost %
Ideal Beverage Cost % = Ideal Beverage COGS / Beverage Sales
Variance (points)
Variance (points) = Actual % − Ideal %
Gross Profit (Beverage)
Gross Profit (Beverage) = Beverage Sales − Beverage COGS
Contribution Margin (per drink)
Contribution Margin (per drink) = Price − Cost
When you price, don’t guess. Use a target-cost approach — like a pricing formula for target cost. The same logic works for drinks, just with a different target %.
And if you want to build high-profit drinks without trashing quality, think like recipe engineering for profit: your margin lever is often the build, not the brand.
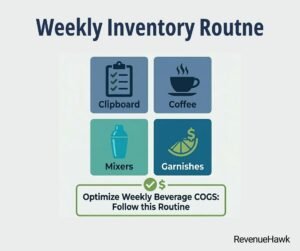
HOW TO MAKE IT LAST
If you want beverage cost to stay consistent, you need repeatable routines and clear standards — not bursts of motivation.
Here’s a weekly operating checklist we’ve seen get the job done time and time again:
- Count inventory same day, same time, same method
- Reconcile purchases (no missed invoices)
- Review top 10 beverage items for variance
- Check comp/void report (manager sign-off)
- Pour checks on top 5 spirits and top draft line
- One quick staff reminder: “this week’s spec focus”
Also, don’t ignore prep. Bars waste just like kitchens. Citrus, purees, syrups — if prep is messy, cost creeps up. Use batch-prep to cut labor and waste thinking to standardize bar prep too.
Finally, make sure your beverage program matches your menu strategy. Our experince shows that bloated menu creates operational chaos. The same logic behind menu engineering basics applies: fewer, better, repeatable wins.
Check Modern Restaurant Management’s 2026 outlook coverage for a broader view of where operators say the industry is heading (value, automation, operational pressure).
THE RESET YOU NEED
High-margin restaurants don’t win on luck. They win by spotting issues early and making quick corrections.
Here are the beliefs we see in top operators:
- If it’s not measured weekly, it’s not managed.
- Variance is a behavior problem, not a math problem.
- The bar is a production line, not an art studio.
- Don’t keep everything — only what earns its space.
That last one matters. If drinks (or food items) don’t pull profit, you cut them — killing low-margin losers.
ACTION PLAN: WHAT TO DO NEXT
To fix beverage cost over the next 30 days, run it like a schedule: (Week 1) clean up your definitions and data, (Week 2) lock recipe specs and pours, (Week 3) install control points for comps and inventory drift, and (Week 4) optimize pricing and menu mix — then train to keep it.
How to prepare data?
- Create one beverage COGS bucket (clear rules)
- Clean invoice coding
- Set weekly inventory count day
- Pull beverage sales (gross and net)
- Run your first weekly actual cost %
How to standardize pours and recipes?
- Document top 20 drink builds
- Cost each recipe
- Set standard pour sizes
- Train and test (10-minute shift line-up)
- Remove free-pour on high-variance cocktails
How do you control comps and drift?
- Manager-only comps
- Daily spot checks on top theft items
- Draft loss checks
- Variance review meeting (15 minutes weekly)
How to raise margin without losing guests?
This is where we see many operators panic — and they shouldn’t. You don’t need to jack prices across the board. You need smart moves: ladder pricing, strategic anchors, and value framing. That’s the whole point of knowing how to increase prices without backlash.
Curious what’s trending in 2026? Fast Casual’s beverage coverage is useful if you want to see what the big players are thinking — and where operators are investing.
MRM’s 2026 research offers a more operational roundup of labor pressure and profitability signals.
FREQUENTLY ASKED QUESTIONS (FAQ)
1) What’s a good beverage cost percentage?
It depends on mix (draft beer vs craft cocktails vs coffee). What matters more: your ideal vs actual variance. If variance is consistently >2 points, you have a control issue.
2) Should I calculate beverage cost weekly or monthly?
Weekly. Monthly is too slow. The goal isn’t perfect accounting — it’s fast correction.
3) Do comps count in beverage cost?
The liquid still got poured, so yes, it’s real cost. The better question: are comps controlled and intentional, or casual and invisible?
4) What if my beverage cost is fine but profits still stink?
Then the problem is pricing, menu mix, or volume. Beverage cost % is one lever, not the whole machine.
FINAL THOUGHTS
If you’re not tracking beverage cost every week, you’re not busy — you’re letting chaos charge you.
Here’s the truth: the bar is one of the easiest places to print margin — but only if it’s treated like a system. Definitions, inventory math, ideal vs actual, variance, then fixes in order. That’s it.
And zoom out: beverage cost is never just beverage cost. It connects to inventory habits, portion control, comp discipline, and menu decisions. These plays are powerful — but the plays here are just a small part of our Restaurant Growth Engine system.