

If your food cost is so high and feels out of control, you’re not alone. Since 2019, the average cost of food and labor for restaurants has jumped by 30% or more.
Here’s what we’ve learned at RevenueHawk after auditing tons of restaurants: inflation isn’t the main reason food costs are out of control. Most of the damage is coming from inside the business. It’s caused by messy systems.
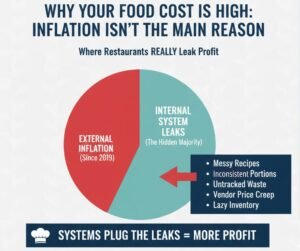
When we evaluate restaurants, we see the same pattern over and over: restaurants with clean recipes, tight inventory, and clear portioning systems still make money in this market. Operators that haven’t implemented measures to lower restaurant food cost leak profit from ten different holes at once.
Among the restaurants we’ve analyzed that complain about high food cost, more than 70% also score poorly on a simple restaurant food cost audit checklist. They’re not “bad operators” — they’re just flying blind:
- No one really knows what each plate costs
- Inventory is a once-a-month chore (if that)
- Waste and comps aren’t tracked with any discipline
- Suppliers quietly raise prices and no one pushes back
So this article is not “10 simple tips to cut food cost.”
This is a systems view of why your food cost is high — and the 7 hidden profit killers we see again and again inside real restaurants.

KEY POINTS: WHAT YOU’LL LEARN
- Step-by-step how to lower food costs: A simple operating rhythm you can run weekly to find and plug the biggest leaks.
- Why this matters: How inflation, menu price pressure, and shifting guest habits make sloppy food cost systems lethal in 2026.
- Case Study: A real-world style breakdown of how a casual concept dropped food cost by 5% without cutting quality.
- Key mistakes: The exact habits that keep operators stuck at 35%+ food cost, even when sales are strong.
- Key metrics: The few formulas that actually move profit so you can ignore vanity metrics.
- How to make it last: How to bake food cost control into pre-shifts, checklists, and dashboards so it doesn’t fall apart in 6 weeks.
- The reset you need: The mindset shift from “cutting cost” to “engineering margin.”
- Action plan (a 30-day playbook): The exact steps to reduce food cost and protect profit.
WHY THIS MATTERS
Food isn’t just “a little more expensive.”According to the Federal Reserve of Saint Luis (FRED) prices for food away from home have grown faster than grocery prices and general inflation over the last decade, nearly 50% higher in 2014–2024.
The U.S. Bureau of Labor Statistics shows the food-away-from-home index recently up about 4% year over year, with full-service meals closer to 5%. Meanwhile, the National Restaurant Association (NRA) tracks steady menu price increases month after month. You feel this every time a case price jumps and your supplier says, “Yeah, that’s just where the market is now.”
91% of restaurant leaders say their food costs increased this year; over a third saw hikes of 6–14%, and 13% got hit with 15%+ spikes.
Big brands aren’t just hoping it gets better. Chains like Chipotle, Olive Garden, Chick-fil-A, and McDonald’s lean hard into:
- Tight menu engineering
- Ruthless product mix review
- Centralized purchasing and prep
They don’t rely on what the chef feels to manage food cost; they rely on systems — inlcluding systems to stop over-portioning.
From what we’re seeing, independents can’t win this fight with instinct and outdated routines. They’ll get squeezed from both sides: rising input costs and guests who are already sensitive to higher menu prices.
That’s why this matters: a loose kitchen in 2015 might have still made money. A loose kitchen in 2026 gets wiped out.
Check out NRA’s latest indicator for more context on how menu prices keep climbing.
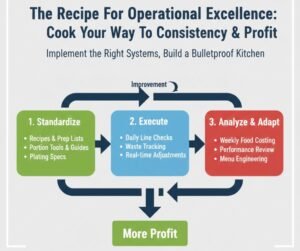
STEP-BY-STEP: HOW TO FIX IT
Here’s the framework we install when RevenueHawk drops into a restaurant with food cost problems. It’s simple, but not easy.
Step 1: Get a Clean Weekly Food Cost Number
You can’t fix what you don’t measure every week.
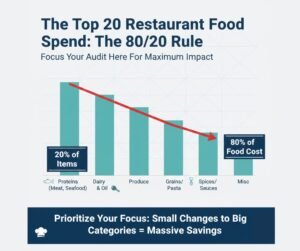
- Do a quick count of your top 20–30 items by spend (not full inventory at first).
- Pull last week’s purchases for those items.
- Pull last week’s food sales.
That’s your first weekly food cost tracking system. You can do it in a spreadsheet before you ever touch software.
RevenueHawk Insight: Our data shows that units that move from monthly to weekly food cost checks reduce food cost by an average of 1.8% within 90 days — without touching menu prices.
Check out the NRA’s “State of the Industry” report if you want a deeper view into what other operators track — and how often.
Step 2: Lock in Recipe Costs
If recipes live in your chef’s head, your food cost is a dice roll.
- Write standard recipes for your top 30 menu items.
- Weigh and measure everything.
- Use current invoice prices to cost each recipe.
Use the step-by-step recipe costing blueprint to calculate restaurant recipe costs accurately. Most operators skip this, then wonder why theoretical and actual food cost never match.
Step 3: Standardize Portions and Plating
Over-portioning is usually a bigger leak than supplier price increases.
- Use ladles, spoodles, scoops, portion scales.
- Put photos or line diagrams at each station.
- Make “portion control” a line-check item, not a one-time training.
Top-performing concepts use a simple restaurant loss-prevention playbook that includes portion tools, random plate audits, and escalation when plates leave the pass too generous or inconsistent.
Step 4: Control Waste, Voids, and Comps
If you’re not reviewing your POS regularly, you’re leaving the door open for mistakes, comps, and discounts to pile up unnoticed:
- Track waste by category (prep errors, spoilage, line mistakes).
- Require manager sign-off on comps and voids.
- Log everything in a simple sheet so you can see patterns.
Step 5: Tighten Ordering and Deliveries
What we’ve seen is that most kitchens either over-order “just to be safe” or under-order and then make emergency buys at retail prices.
- Order against a par based on actual usage, not vibes.
- Compare deliveries to POs and invoices every time.
- Log shortages and substitutions so your recipe costs stay real.
When you’re ready to push harder on pricing, read our supplier negotiation playbook. But don’t waste time fighting for nickels while your team is tossing dollars in the trash.
![]()
Step 6: Make It a Weekly Meeting, Not a Spreadsheet in a Drawer
If it doesn’t get talked about weekly, it doesn’t get fixed. Make this a weekly habit:
- Review food cost vs last week and vs last year
- Look at top 10 selling items and their margins
- Review waste log, comps, and void patterns
- Pick 1–2 actions (not 20) for the coming week
CASE STUDY: A REAL EXAMPLE
Restaurant Type:
Casual full-service grill
Location:
Suburban strip center
Seats:
120
Problem Identified:
Food cost stuck at 36–37% despite solid sales
What Was Implemented:
- Weekly food cost tracking on top 40 items
- Standard recipes for top 25 menu items
- Portion tools on all stations
- Waste and comps logging with manager review
- Targeted supplier renegotiation
Results (first 90 days):
- Food cost dropped from 36.8% to 31.5%
- Weekly waste (at cost) cut by 42%
- Gross profit per cover up by $1.14
- No menu price increase during this period
RevenueHawk data shows this is normal, not exceptional. The biggest jump wasn’t from cheaper product — it was from fewer mistakes and tighter systems.
KEY MISTAKES: WHAT TO AVOID
Here are the patterns we keep seeing that drive high food cost — even in busy, high-sales restaurants:
- Trying to grow before fixing margins
Adding more volume to a broken system just multiplies your losses. - Scheduling based on gut instead of productivity
Over-staffed prep leads to over-production, and over-production leads to trash. - Letting staff eyeball portions
“They know the plate” is famous last words. That’s how you undo your batch prep systems that lower waste and end up with portion drift. - Keeping low-margin dishes because “customers like them”
Every menu needs a regular kill-the-losers menu review. If guests only order a dish on promo and it runs at a 40% food cost, it’s not a guest favorite — it’s a tax. - Assuming more customers equals more profit
If your food cost is 35% and you’re discounting to fill seats, you may be adding volume while making less actual money. - Relying on marketing to cover operational gaps
Paid ads and loyalty programs can’t save a kitchen leaking 3–5 points of margin through waste, over-portioning, and poor recipe control.
METRICS: THE NUMBERS THAT MATTER
Here are the formulas we care about when we audit a restaurant’s food economics.
1. Food Cost %
Food Cost % = (Beginning Inventory + Purchases – Ending Inventory) / Food Sales
Targets vary, but most profitable concepts we see sit roughly:
- Full service: 28–32%
- Limited service: 24–30%
This is also where a restaurant pricing formula for 28% food cost comes in. You reverse-engineer menu prices from desired margin, not from “what sounds fair.”
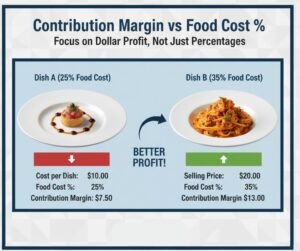
2. Contribution Margin
Contribution Margin = Selling Price – Cost per Dish
Don’t just ask “What’s the food cost %?” Ask “How many dollars does this plate contribute?”
That’s the heart of recipe engineering for high-profit dishes. Sometimes a 32% food cost item throws off more dollars than a 26% one — and deserves more menu real estate.
3. Prime Cost %
Prime Cost % = (COGS + Labor) / Total Sales
Food cost doesn’t live alone. If your line is slow or your menu is too complex, labor balloons, and prime cost kills you even if food cost looks fine.
4. Throughput
Throughput = Guests Served per Hour per Station
We see a clear pattern: restaurants that simplify the menu and tighten the line often raise throughput 10–20% with the same labor.
HOW TO MAKE IT LAST: (THE OPERATING CHECKLIST)
Here’s how top operators turn a food cost project into a plan how to run the place.
Daily
- Line check with portion tools in hand
- Temperatures and waste log at each station
- Manager reviews any unusual voids and comps
- Bar does a quick usage check on key spirits and beer
This is also where you quietly calculate beverage cost percentage. The bar is often the fastest way to add 1–2 profit points without touching the kitchen.
Weekly
- Run your food cost for the week
- Review product mix and identify low-margin items to push down or kill
- Update recipes when supplier prices move
- Walk the cooler with inventory sheets in hand
Use this routine as your plan to fix sudden food cost spikes instead of panicking after a brutal monthly P&L.
THE RESET YOU NEED
Here’s the mental reset we push:
- You don’t win by working harder — you win by removing chaos.
- Systems beat talent. A rockstar chef without process will leak more profit than a solid cook in a tight system.
- Numbers beat guessing. Weekly tracking always beats “I think it’s around 30%.”
- Consistency beats effort. Quiet, repeatable habits like daily restaurant inventory habits drive more profit than one huge “kitchen reset” every six months.
ACTION PLAN: WHAT TO DO NEXT
Here’s a simple 30-day plan you can use to reduce high food costs — no special software required:
Week 1
- Pick your top 30 menu items by sales.
- Cost each one using current invoices.
- Start tracking weekly food cost on your top 20 spend items.
Adopt a menu engineering mindset — you are a menu designer, not just a menu printer.
Week 2
- Put portion tools and station photos in place for those top movers.
- Start a simple waste and comps log (paper or tablet).
- Do one cooler walk with your chef to spot obvious waste.
Week 3
- Identify 3–5 low-margin dishes. Decide: raise price, re-engineer recipe, or kill.
- Have your first mini-supplier review: top 10 SKUs by spend, price trend, and alternatives.
Week 4
- Run a full 4-week food cost. Compare week 1 vs week 4.
- Lock in a recurring weekly food cost meeting on the calendar.
Check QSR’s menu simplification article for inspiration on how operators are using menu and systems to protect margin.
FREQUENTLY ASKED QUESTIONS (FAQ)
Q1: What’s a “good” food cost percentage?
Most healthy concepts we see land in the high-20s to low-30s. Your number depends on your segment, concept, and check average. What matters more is: are you tracking it weekly, and do you understand what’s driving it? Industry dashboards like the NRA’s data hub can give helpful context by segment.
Q2: Do I need expensive software to control food cost?
No. Software helps, but only if your underlying habits are solid. We’ve seen restaurants drop 3–5 points of food cost using spreadsheets, scales, and clipboards. If you later add software, it should just make your existing discipline easier, not replace it.
Q3: How do I raise prices without scaring guests away?
First, fix your leaks. Then, when your house is in order, use raise menu prices without losing guests tactics including smaller targeted increases on high-value items and menu design to guide eyes.
Q4: Where should I start if everything feels broken?
Start with one store, one category, and one habit. Win one small battle first. Then copy-paste the system.
FINAL THOUGHTS
If your food cost is high, you don’t have a bad chef or greedy supplier problem. You have a systems problem.
The restaurants winning in this environment are not the ones working the most hours. They are the ones that:
- Cost recipes ruthlessly
- Track numbers weekly, not monthly
- Kill weak menu items fast
- Negotiate with data, not desperation
At RevenueHawk, we’ve seen the same movie play out in thousands of locations: once operators see food cost as a system, not a mystery, they unlock 3–7 extra profit points without torpedoing guest experience.
And the plays here — from portion control to waste tracking to negotiation — are just a small part of our Restaurant Growth Engine system. The real leverage comes when you connect them all: menu, labor, inventory, and pricing working together instead of fighting each other.
You don’t need perfection to win. You just need to stop the 7 hidden profit killers and commit to a simple, boring weekly rhythm that protects your margins — every single week.