

Here is the question we usually ask operators “What if your restaurant food cost isn’t “high”… it’s just unsupervised?”.
At RevenueHawk, we’ve watched the same movie play out in kitchen after kitchen: owners fight the main number (food cost %) while the real damage comes from many tiny leaks that never hit anyone’s to-do list.
Here’s one pattern that we see constantly: when a restaurant says, “Vendor prices went up,” we usually find hidden food-cost profit killers that had nothing to do with the vendor:
- recipe cards not updated for months
- yields ignored (trim, cook loss, prep loss)
- over-portioning that’s “only a little” (until it’s 500 times a week)
- incorrect receiving (shorts + subs + missing credits)
- “phantom comps” and voids with no notes
- prep done too early leading to spoilage
- low-margin items that quietly dominate sales mix
When we review invoice-and-recipe sets, the most common issue we see isn’t “price inflation.” It’s outdated recipe costs and unmeasured yield loss, which push theoretical food cost off by 2.1–4.8% before a single steak hits the grill.
And 2026 is not the year to stay loose. USDA projects slower-but-still-rising food prices in 2026 (including food-away-from-home), which means you’ll get squeezed if your controls are sloppy.

KEY POINTS: WHAT YOU’LL LEARN
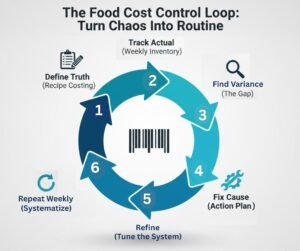
- Step-by-step how to fix It: You’ll install a simple “food cost control loop” that turns chaos into a weekly routine.
- Why this matters: You’ll see why the old advice (“raise prices” or “watch waste”) fails in 2026—and what replaces it.
- A real example: A known brand playbook, translated into what an independent can actually copy.
- Mistakes to avoid: The traps that feel like work but don’t move food cost.
- Metrics: The handful of formulas that make food cost boring (that’s the goal).
- Make It last: How to keep the gains when you’re busy, short-staffed, and tired.
- The reset you need: A blunt mindset shift: food cost isn’t a kitchen issue—it’s a management system.
- Action Plan: A tight 7-day + 30-day plan you can execute without new software.
WHY THIS MATTERS
Food cost pressure didn’t disappear — it just changed shape.
- Menu prices are still moving, and restaurants keep trying to price their way out. The U.S. Bureau of Labor Statistics (BLS) official CPI shows food-away-from-home inflation staying meaningful over the past year.
- Operators report cost increases as a norm, not a surprise. Restaurant Dive reported a large share of restaurant leaders saw food costs rise in 2025, with many seeing multi-point jumps.
- Supply chain volatility (tariffs, disruptions, substitutions) keeps popping up, and it messes with consistency. McKinsey’s supply chain risk coverage in 2025 is basically a warning label for operators: volatility is normal now.
Why traditional solutions fail to lower restaurant food cost?
- What we see is that the “Just cut waste” strategy simply fails because nobody defined waste, logged it, or assigned ownership.
- The “Just raise prices” approach is not very successful either because certain guest groups are price-sensitive and your menu mix might be wrong.
- And “Just negotiate suppliers” fails because negotiation without specs and purchasing discipline is a discount that evaporates.
What operators are missing
Most restaurant operators we talk to don’t have a system for variance: the gap between what food should cost (theoretical) and what it did actually cost. Until you run that gap down, you’ll keep feeling “unlucky.”
Why this matters now
Consumer behavior is shifting (timing, habits, spend patterns), and the winners will be the restaurants that run tighter operations, not the ones that post more on Instagram. For a pulse on diner behavior heading into 2026, OpenTable’s 2026 Trends Report should be very helpful.
Price spikes aren’t “if.” They’re “when.” If you don’t have a repeatable response, you’re not managing costs — you’re hoping. That’s why you should focus on fixing sudden food-cost spikes for good. So when prices jump, you don’t scramble or guess. You just follow a routine — same steps every time.
STEP-BY-STEP: HOW TO LOWER RESTAURANT FOOD COST
This is the RevenueHawk food-cost mechanism. It’s not magic. It’s a simple loop you follow: (Step 1) Define theoretical, (Step 2) track actual, (Step 3) find variance, (Step 4) fix the cause, (Step 5) repeat weekly.
Step 1 — Build your “truth”: recipe cost that matches reality
Let’s be clear: if your recipe costing is wrong, your decisions will most likely be wrong.
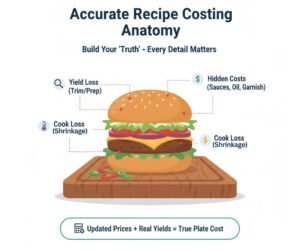
It’s very important that you know how to do accurate recipe costing, which means:
- Use yields (trim loss, cook loss, drained weight, peeled weight)
- Update pack sizes (vendors love changing them quietly)
- Include garnish, oil and sauces (the “small stuff” is never small at volume)
- Timebox updates: top 20 sellers weekly and full menu monthly
Don’t miss this: if you only update recipes “when prices change,” you’re already late. Food cost is a process you run weekly — not something you react to when it hurts.
Step 2 — Track restaurant food cost weekly (or you’re guessing)
Monthly food cost is a history book. Weekly food cost is a steering wheel. Track food cost weekly like a pro — with or without expensive software:
Weekly Actual Food Cost (simple) = Starting inventory (value) + Purchases (value) − Ending inventory (value)
Do it the same day every week. Use the same cutoff and same method.
For a public benchmark on menu price movement — which directly impacts your denominator (sales) — use the National Restaurant Association’s menu price indicator. And FRED CPI “food away from home” series gives a long-view chart you can reference in owner meetings.
Don’t miss this: If you don’t have time for weekly food cost, you’re choosing surprise losses over boring profits.
Step 3 — Lock plate cost by standardizing portions (not by yelling)
Most restaurants don’t have so much a food cost problem, but rather a portion drift problem.
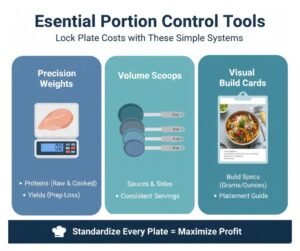
Put in place portion-control systems that lock plate cost:
- Weights for proteins (cooked and raw specs)
- Ladles and spoodles for sides/sauces (labeled by ounces)
- Build cards at the pass (pictures and grams/ounces)
- Pre-portion for peak (remove decision-making under pressure)
- Manager plate checks (random, calm, consistent)
RevenueHawk Insight (portion drift): In 60-unit samples we audited, the #1 drift item was protein, averaging 6–18% over spec during peak hours. The fix wasn’t training. It was tools, enforcement and prep.
Step 4 — Stop the silent killers: waste, theft, and shrink
If your theoretical cost is solid and your portions are tight, the next leak is loss.
You need to stop waste, theft, and shrink with three controls:
- Receiving discipline: weigh/scan, check substitutions, log credits immediately
- Waste logging that leads to action: not a clipboard graveyard
- Access control: high-value items in one location, one keyholder per shift
Don’t miss this: “Food waste” is not a kitchen personality flaw. It’s a missing system.
Step 5 — Win the day with inventory habits (not heroic counts)
Do you think big monthly inventory counts are the way to go because they feel responsible? They’re not. They’re late.
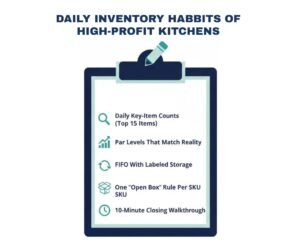
Use these 5 daily inventory habits of high-profit kitchens:
- Daily key-item counts (top 15 high-cost/high-theft items)
- Par levels that match reality (seasonality + daypart)
- FIFO with labels that people actually follow
- One “open box” rule per SKU whenever possible
- A 10-minute close checklist (walk-in, freezer, dry, line)
This is how you prevent variance from compounding for four weeks.
Step 6 — Cut labor and waste with batch-prep that’s sized right
What we know is that prep is where money disappears quietly.
Put in batch-prep systems that cut waste and labor:
- You must prep to a forecast, not a vibe
- Use “prep batches” tied to sales (e.g., 1 batch = 25 orders)
- Tighten hold times; stop prepping tomorrow’s spoilage today
- Build a mid-shift “prep top-off” instead of one giant morning push
Don’t miss this: Here’s the trap — over-prep leads to over-portioning. Both are the same disease: people guessing instead of following a target.
Step 7 — Fix your menu mix (because the menu is a profit machine)
Unfortunately, even perfect control won’t save a menu that’s structurally unprofitable. If the math doesn’t work, you’ll “manage” your way to zero profit.
Start with menu engineering 101 for high-margin mix:
- Identify your Stars (high margin, high volume)
- Identify your Plowhorses (low margin, high volume)
- Identify your Puzzles (high margin, low volume)
- Identify your Dogs (low margin, low volume)
Then redesign: placement, naming, bundles, and server prompts to shift mix.
Check out Technomic’s forward-looking view and predictions on the trends that may shape menu decisions in 2026.
CASE STUDY: A REAL EXAMPLE (KNOWN BRAND’S APPROVED SUPPLIERS AND STANDARDS MINDSET, APPLIED LOCALLY)
Restaurant Type
Fast-casual burrito concept (independent)
Location
Metro suburb
Seats
84
Problem Identified
Food cost stuck at 36–38% with random spikes; owners blamed vendors.
What Was Implemented
We copied a known brand discipline: tighter supplier list and tighter specs plus tighter receiving
Chipotle describes in its filings a high-focus approach to standards and working closely with suppliers — limited approved suppliers, strong programs, tight monitoring.
We translated that mindset into an independent operator play:
- reduced “whatever vendor is cheapest this week” behavior
- locked specs for top 12 SKUs (protein, tortillas, cheese, oil)
- added receiving checks and credit tracking
- introduced negotiation tactics to cut unit costs
Results (12 weeks)
- food cost dropped from 37.4% to 32.1%
- variance (theoretical vs actual) shrank by 2.9%
- top-3 spike items (cheese, steak, avocado) stopped “surprising” them because pricing and yields were updated weekly
Key point: Negotiation worked because the specs and purchasing discipline made the savings real.
KEY MISTAKES: WHAT TO AVOID
Here are the mistakes we usually see and the moves that waste time:
- “We’ll grow sales first, then fix margins.” (No. Fix leaks first.)
- Scheduling by gut, not throughput.
- Letting staff eyeball portions because “they’re experienced.”
- Keeping low-margin dishes because “customers like them,” without data.
- Assuming more customers equals more profit.
- Relying on marketing to cover operational gaps.
And the biggest menu mistake: Keeping items that actively hurt you. You need to remove low-margin menu losers.
Don’t miss this: A menu item that sells well and makes no money is not “popular.” It’s a parasite.
METRICS: THE NUMBERS THAT MATTER
If you only track one thing, track variance. But you need these too:
Food Cost %
Food Cost % = COGS / Food Sales
Labor Productivity
Covers per Labor Hour = Total Covers / Total Labor Hours
Contribution Margin (per dish)
Contribution Margin = Selling Price − Plate Cost
Prime Cost %
Prime Cost % = (COGS + Labor) / Sales
Throughput (station)
Throughput = Guests served per hour per station
The pricing target most operators actually want
Target Price = Plate Cost / Target Food Cost %
Check out how to price your menu for 28% food cost:
Now the sleeper metric that prints money:
Beverage Cost %
Beverage Cost % = Beverage COGS / Beverage Sales
Beverage margins are often the easiest way to offset food volatility — if you track it separately and stop free-pouring like it’s a sport. You should know how to calculate beverage cost percentage.
MAKE IT LAST: THIS IS YOUR FOOD COST LOWERING CHECKLIST
What we’ve seen over the years is that most restaurants don’t fail because they didn’t know what to do. They fail because they didn’t build a cadence.
Here’s the cadence that keeps food costs down — even on busiest nights:
Daily (10–20 minutes)
- key-item counts (15 items)
- waste log reviewed and one fix chosen
- line check for portion tools and build cards
Weekly (60–90 minutes)
- update top sellers’ recipe costs
- run actual food cost (inventory and purchases)
- review variance and pick one root cause to attack
- run a short menu mix report
Monthly (2–3 hours)
- full recipe refresh
- supplier review (credits, compliance, substitutions)
- menu changes (remove, re-price, re-engineer)
And this is where you bake in real profit creation with recipe engineering for high-profit dishes — you design dishes that are harder to mess up, easier to portion, and naturally margin-friendly (without feeling cheap).
THE RESET YOU NEED
You need to change your mindset from thinking you win by working harder to thinking you win by removing chaos.
Lock this in:
- Systems beat talent.
- Numbers beat guessing.
- Consistency beats effort.
Food cost is not a “kitchen problem.” It’s a system problem with a kitchen symptom.
ACTION PLAN: WHAT TO DO NEXT
Here’s what we advise operators to do when they’re stuck with high food costs — a next-step plan to take control and keep it:
Next 7 days
- Pick your weekly inventory day and lock it.
- Cost your top 20 sellers with yields.
- Set portion tools for the 5 highest-cost plates.
- Start daily key counts on 15 items.
- Run your first variance check (theoretical vs actual).
Next 30 days
- Remove or rework 5 losing items.
- Implement receiving checks + credit tracking.
- Install batch-prep forecasting for your top prep items.
- Reprice 10 items using your target formula.
- Train servers to guide mix (Stars first).
When you reprice menu items, you should do it like a pro by using pricing psychology tips to raise prices.
FREQUENTLY ASKED QUESTIONS (FAQ)
Q1: What’s a “good” food cost % in 2026?
It depends on your concept. The better question is: What’s your variance? A 30% food cost with high variance is less safe than a 33% with tight variance.
Q2: Should I negotiate vendors first or fix operations first?
Always fix operations first. Negotiation savings vanish if portioning, waste, and receiving are loose.
Q3: Do I need software to do this?
No. You need a weekly cadence. Software can help later, but it can’t replace discipline.
Q4: Why do my costs spike even when sales look normal?
Usually, the issues are: (1) yield problems, (2) receiving/credits, (3) portion drift, or (4) a menu mix shift. Track weekly and the “mystery” stops.
FINAL THOUGHTS
If your plan is to work harder and hope, you’re not managing — you’re gambling.
Food cost drops when the business becomes measurable and repeatable:
- you know what it should cost
- you measure what it did cost
- you fix the gap
- you repeat weekly
These plays are just one slice of our broader Restaurant Growth Engine system — because real growth isn’t one trick. It’s a full stack of systems that stop leaks, protect margins, and make results predictable.