

Some restaurants run 25–28% food cost and stack cash. Others hover at 35–40% and feel broke even on “busy” weeks. Same market. Same suppliers. Same inflation. The Restaurant Food Cost Audit is how you stop guessing, find the waste, and keep more profit on every plate.
Operators tell us all the time they want to know how to bring food cost down and keep more profit. But from what we’ve seen at RevenueHawk, the winners aren’t winning because they cook better or buy cheaper. It’s just one simple thing: the operators who win run a ruthless weekly food-cost audit. The ones who lose… don’t.
On our platform, we analyzed thousands of restaurants. Operators who ran a consistent 15-point weekly audit cut average food cost from 36.1% to 30.9% in 90 days — without changing their concept or doing a remodel.
Here’s the deal: if you want to find your hidden profit killers, but you’re not checking for leaks every week, you’re guessing. Guessing is not a strategy.
And if guests are paying more, but that extra money isn’t hitting your bottom line, it’s leaking somewhere in your system. This checklist is how you find the leaks—every single week.

KEY POINTS: WHAT YOU’LL LEARN
- Step-by-step how to find leaks: The exact 15-point weekly audit we use with clients to control food cost—down to what to check, where, and how long it should take.
- Why this matters: How food-cost control ties into survival in an environment where menu price inflation is slowing but your inputs are still rising.
- Case Study: A real-world, anonymized multi-unit operator who used this audit to claw back 6 percentage points of food cost in 8 weeks.
- Key mistakes: The traps that keep most operators stuck — like thinking your POS reports alone will save you, or ignoring vendor creep.
- Key metrics: The few numbers you actually need weekly
- Make it last: How to turn the audit into a 60–90 minute block on the calendar every week instead of a one-time panic move.
- The reset you need: The mindset shift from “I hope food cost is okay” to “I know exactly why it’s 29% this week.”
- Action plan: A simple next-week and next-30-day plan so this doesn’t just stay in your notes app.
WHY THIS MATTERS
Let’s be honest: the margin game is getting tighter and tighter, and the room for error keeps getting smaller.
If you want to see how tight this game really is, look at the National Restaurant Association’s breakdown of rising costs and thin margins. At the same time, USDA data shows food prices still climbing around 3% per year, with restaurant food prices rising even faster.
Guests feel it. They’re pickier about value, and they notice sloppy pricing and cheapening quality. Nation’s Restaurant News has covered growing “menu price fatigue” as consumers push back on constant increases.
So where do most operators go wrong?
They try to fix food cost by yelling in pre-shift:
- “Smaller portions!”
- “Stop wasting product!”
- “Watch the comps!”
That’s not a system. That’s wishful thinking.
The real killers live inside inconsistent portions, sloppy inventory, and chef’s choice specials that ignore over-portioning control systems. Your weekly food cost audit is the only way to connect all of that into one clear picture.
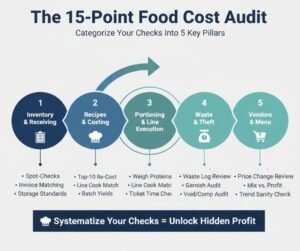
STEP-BY-STEP: THE 15-POINT WEEKLY FOOD COST AUDIT
This is the 15-point audit we run with clients every week. It takes 60–90 minutes once the system is set.
RevenueHawk Insight: Across the restaurants that adopted this checklist, median food cost dropped by 4.3 percentage points in 6 weeks and stabilized within a 2-point band week-to-week. The big win wasn’t just lower cost — it was predictability.
We’ll group the 15 points into five buckets: Inventory, Recipes, Portioning, Waste/Theft, and Vendors/Menu.
A. Inventory & Receiving (Points 1–4)
1. Verify opening and closing inventory accuracy
- Spot-check at least 5 high-value items (protein, cheese, oils, key beverages).
- Compare what’s on the shelf vs what’s in the system.
- If variance is more than 2–3% on those items, you don’t have real numbers.
Restaurant.org article confirms why accurate counts and waste tracking are core to profitability
2. Check receiving vs invoices
- Randomly choose 3–5 deliveries from the week.
- Confirm weights, counts, and quality against invoices.
- Require managers to sign off on discrepancies on the spot.
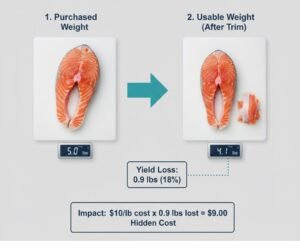
3. Lock in a weekly cut sheet for key items
- For meats, seafood, and produce, track yield: raw weight vs usable weight.
- This ties directly into accurate recipe costing.
4. Confirm storage standards
- FIFO in every cooler.
- Labels with date and item name.
- No mystery pans.
FSR Magazine has a good rundown on strategies to reduce inventory loss and why discipline here saves thousands.
B. Recipes & Costing (Points 5–7)
5. Re-cost your top 10 selling items weekly
- Pull actual purchase prices from this week.
- Recalculate plate cost on your top 10 movers.
- Log the change vs last month.
This is where real loss-prevention against waste and theft begins — not just locking the liquor room, but knowing when costs silently creep 3–4% on your bestsellers.
6. Verify that recipe cards match how the line actually cooks
- Stand on the line for 20 minutes during service.
- Watch three different cooks make the same dish.
- Are portions, garnishes, and build consistent with the card? If not, your recipes are fiction.
7. Check batch recipes and yields
- For soups, sauces, and prepped items, record actual yield vs theoretical.
- Fix processes where you consistently lose yield (over-trim, over-reduce, etc.).
Inventory pros, in an FSR Magazine article, warn that spreadsheets only get you so far. At some point, you need systems that tie recipes to real, actual usage.
C. Portioning & Line Execution (Points 8–10)
8. Scale and weigh key proteins and high-cost items
- Choose 5–10 items (steaks, salmon, wings, cheese, avocado).
- Weigh actual portions going on plates during a rush.
- Compare to target. Anything over by 10% is a red flag.
This is where you need systems to stop over-portioning. Just eyeballing it is not a system.
9. Audit plate build and garnishes
- Are line cooks adding extra ramekins, bigger scoops, or bonus sides?
- A “little extra” repeated 300 times a week is a full shift of labor in lost margin.
10. Check ticket times vs portioning shortcuts
- If ticket times spike, cooks start throwing on bigger portions “to keep guests happy.”
- Fix root causes (station layout, prep) instead of letting food cost take the hit.
D. Waste, Voids, and Comps (Points 11–12)
11. Review your waste log
- Every week, review: what’s getting tossed, how often, and why.
- Match this against prep levels and ordering.
Restaurant.org’s food waste guidance shows how simple tracking and repurposing can materially reduce rising costs.
12. Audit voids, comps, and discounts
- Pull POS reports for the week.
- Look for repeating patterns by server, item, or shift.
- Unexplained voids and missing inventory = problem.
E. Vendors & Menu (Points 13–15)
13. Review price changes from suppliers
- Pull last 4 weeks of invoices for your top 20 items.
- Flag any unit cost that’s moved more than 3%.
- Decide: accept, negotiate, swap, or re-engineer recipes.
Skipping this step is how you quietly give up thousands you owe yourself. You need to use supplier negotiation tactics to lower unit costs, even if it’s just a monthly cadence and a short list of must-win items.
14. Compare item mix vs profitability
- Look at sales mix: what’s actually selling vs what’s most profitable.
- This is the early warning system before you have to kill the low-margin menu losers.
15. Sanity-check menu against actual food cost trend
- If food cost has drifted up 2–3 percentage points for three weeks in a row, you don’t have a bad week — you have a pattern.
- Use your audit findings (waste, prices, portions) to decide whether to adjust recipes, vendors, or prices.
QSR has shown how leading brands use data, not vibes, to make these calls.
CASE STUDY: SUBURBAN MULTI-UNIT GROUP
Restaurant Type
Casual dining, scratch kitchen
Location
Suburban multi-unit group (U.S.)
Seats
~140 per unit, 5 locations
Problem Identified
- Food cost floating between 36–38%
- Constant “surprises” when monthly P&L arrived
- Owner felt like they were working for the landlord and the vendor, not themselves
What Was Implemented
- The 15-point weekly audit as described above
- One manager in each store owned the checklist; the DO reviewed results every Monday
- Focus for first 30 days: recipe costing on top 15 items, portion control on proteins, and one round of menu cleanup
Results (8 weeks)
- Food cost dropped from 37.2% to 31.4%
- Variance between theoretical and actual food cost shrank from 7.1% to 2.9%
- They cut 6 low-margin dishes and raised prices on 5 signature items
- Weekly cash flow improved by ~$8,400 across the group
KEY MISTAKES: WHAT TO AVOID
We see this all the time. Here’s what’s getting you stuck — and draining your profit:
- Trying to grow before fixing margins
If every extra dollar of sales leaks 40 cents in food, more volume just scales your problems. - Scheduling based on gut instead of productivity
You overstaff the line “just in case” and then feel you have to send out fat plates so guests feel value. - Letting staff eyeball portions
“They’ve been here forever, they know” is not a control. It’s a prayer. - Ignoring vendor creep
Not having a supplier negotiation playbook to lower unit costs means you’re slowly donating margin every time markets move. - Never redesigning recipes on purpose
Running the same plates you created 5 years ago, with today’s prices, is a quiet profit-killer. Skipping recipe engineering for high-profit dishes is like refusing free money. - Assuming more customers equals more profit
If your systems are weak, more volume just makes the leaks faster and harder to see.
METRICS: THE NUMBERS THAT MATTER
Here are the few numbers that matter for your weekly audit.
Food Cost %
This is where your pricing formula that targets a 28% food cost lives or dies.
Theoretical Food Cost %
Using your recipes and prices:
Food Cost Variance %
If this is more than 2–3 points, you have operational leaks (waste, theft, portioning, receiving).
Beverage Cost %
Dialing this in is how you start calculating beverage cost percentage for higher margins and using the bar to subsidize the kitchen when needed.
Contribution Margin (Per Dish)
Contribution Margin = Selling Price – Recipe Cost
High contribution margin + good sales volume = your real heroes. Low margin + decent sales volume = items that quietly drain profit.
Prime Cost %
Most healthy restaurants aim to keep this under 60–65%; lower is better.
Throughput
Throughput = Guests Served / Labor Hours / Stations
This tells you how many guests each station can realistically handle. It’s how you protect speed and consistency while you adjust recipes and batches.
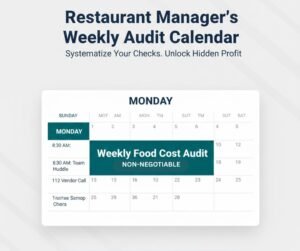
HOW TO MAKE IT LAST
Remember: the audit isn’t magic. A checklist only matters if it becomes a habit. Here’s how to lock it in.
-
Put the audit on your calendar
- Same time every week (e.g., Monday 9–10:30 a.m.).
- Non-negotiable unless the building is on fire.
-
Assign one owner and one backup
- GM owns it.
- KM or AGM is backup.
- “Everyone’s responsible” doesn’t work, because it usually means nobody is.
-
Standardize the tools
- Use same forms, same spreadsheet, same reports every week.
- No new layout every time someone tweaks it.
-
Start with just 10 of the 15 points for the first 2 weeks
- Then add the rest once the team gets used to the rhythm.
-
Review results with your leadership team
- 10–15 minutes weekly to look at trends and pick 1–2 actions.
This turns the 15-point checklist into inventory management habits, not another forgotten initiative.
THE CHANGE YOU NEED
You don’t win by working harder on the line. You win by removing chaos from the system.
- Systems beat talent.
- Numbers beat guessing.
- Consistency beats heroic effort.
That’s why we push operators toward menu engineering for a high-margin menu instead of “what sounds good tonight?” as a strategy.
You can’t price in one corner, change the mix in another, and then act surprised when margins get crushed. McKinsey’s view: tie the levers together and run them as one system.

ACTION PLAN: WHAT TO DO NEXT
Ready to move? Here’s the plan for next week — run it exactly like this.
This Week (Next 7 Days)
- Block 90 minutes for your first food-cost audit.
- Run the lite version:
- Inventory accuracy
- Top 10 item recipe costing
- Portion checks on 5 proteins
- Waste + voids review
- Capture three actions you’ll take based on what you find.
Next 30 Days
- Expand to the full 15-point checklist.
- Train one backup owner for the audit.
- Use insights to refine recipes, vendors, and pricing.
- When results are clear, start to raise menu prices the right way on 3–5 high-value items where guests see strong perceived value.
FREQUENTLY ASKED QUESTIONS (FAQ)
Q1: How often should I run this 15-point audit?
Do it weekly. Monthly is too slow — you only catch problems once they’re big and expensive. Weekly gives you 52 chances a year to course-correct.
Q2: What if I don’t have fancy software?
You don’t need it to start. A shared spreadsheet, printed checklist, and your POS reports are enough. Later, software can speed up what you already do well.
Q3: Who should own the audit in a small restaurant?
Usually the GM or owner, with a key line leader assisting. The main requirement: whoever owns it must have authority to change prep levels, recipes, and ordering.
Q4: What’s a “good” food cost target?
Depends on concept, but a common target for most full-service restaurants is food cost in the high-20% to low-30% range. Fast casual can often run lower. The real goal: stable, predictable food cost that matches your pricing strategy.
FINAL THOUGHTS
If your food cost feels “mysterious,” it’s not because the universe hates you. It’s because you’re running a multi-thousand-dollar machine every week with no standard inspection.
This 15-point weekly checklist is that inspection. It finds the leaks in your recipes, your line, your inventory, your vendors, and your menu design — before they snowball into a 38% food-cost month and a miserable P&L.
At RevenueHawk, we see the same pattern over and over: the restaurants that commit to this kind of discipline stop playing defense with their margins. They understand exactly why food cost is what it is, and they have levers they can pull on demand.
The plays here are just a small part of our Restaurant Growth Engine system — but if all you did was implement this 15-point food cost audit every week, you’d already be ahead of most of your competitors.