

After studing restaurants across every level – QSR, fast casual, casual dining, premium casual, and fine dining – one thing became painfully clear: At RevenueHawk we discovered that most owners don’t actually run their restaurant from a restaurant profitability formula. This was very suprising to us since every business should be run based on rational decision making.
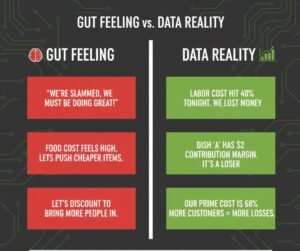
It turns that they run it mostly from feelings and random decision making.
- “We’re slammed, we must be doing great.”
- “Food cost feels high, let’s push cheaper items.”
- “Let’s discount to bring more people in.”
Meanwhile, we’ve seen that the restaurants that grow predictably and stay profitable in ugly markets are those that have the same thing in common: They think of their restaurant as a system – a money making machine – not an annoying list of problems.
And they manage that system through a simple, repeatable profitability formu
From our dataset, we built a 16-factor Revenue Growth Engine™ model and the Profit
- Profit doesn’t move just because you “try harder.”; and
- Profit moves only when multiple drivers line up behind a clear formula.
In this article, I’ll show you the core profitability for
You can also see how your numbers map across 16 profitability factors using the tool below:

KEY POINTS: WHAT YOU’LL LEARN
By the end of this article, you’ll know:
- Step-by-step how to turn sales into profit: Learn the formula and how your restaurant actually makes money, then tweak the key drivers so growth puts cash in your pocket—not just more work.
- Why this matters: Running your restaurant by a clear profit formula turns “busy and broke” into predictable, sustainable profit.
- Real example: Apply the formula that lifted net profit from 2–3% to 14–16% at higher sales, without chaos.
- Key mistakes to avoid: Chasing traffic, guessing on scheduling, eyeballing portions, and assuming sales automatically mean profit.
- Key metrics: Tracking a few core numbers weekly makes profit problems visible and fixable.
- How to turn it into a system: Measure, fix the weakest lever, repeat — so profit improves week after week instead of season by season.
- The reset you need to make: Stop asking “Are we busy?” and start asking “How much profit do we make per hour we’re open?
- Action plan: A 6-step sequence that turns effort into cash flow and growth into real profit.
WHY THIS MATTERS
Let’s be clear here.
The highly professional brands that dominate – think McDonald’s, Chipotle, Starbucks, Texas Roadhouse – are not guessing. They don’t say “let’s hope this works.” They run everything through so-called unit economics:
- “What’s the profit per guest?”
- “What’s the profit per labor hour?”
- “What’s the profit per square foot?”
They know their numbers before they start any strategy or launch anything, especially when addressing growth and profitability challenges. For a quick snapshot of sales sales expectations and operating pressures and what the industry is currently facing, see the National Restaurant Association’s State of the Restaurant Industry report.
Unfortunately, we’ve noticed time and time again that most independent restaurants flip the script — in the worst way. They do the opposite:
- They launch marketing before they haven’t fixed their prime cost and other major leaks in their business model.
- They add more menu items before they understand contribution margin.
- They chase “busy” instead of profitable.

Why this article matters right now:
- Food and labor costs are volatile – see wage and hour trends in the sector tracked by U.S Bureau of Labor Statistics (BLS).
- Guests are becoming more price-sensitive. That ‘value squeeze’ is exactly what McKinsey is seeing in 2026 dining behavior.
- Delivery and 3rd party fees are eating margins.
(For a broader list of operator headwinds moving forward, read an article from The Food Institute.)
If you don’t have a clear profitability formula, you will keep working harder, adding stress, and still not knowing why the bank account never matches the sales report. We want to help you fix that. Let’s start now.
STEP-BY-STEP: HOW TO FIX YOUR PROFIT FORMULA
To keep things easy for you, we’re going to build a simple formula you can write on a whiteboard and use with your managers.
Step 1: Understand the Core Formula
At the highest level:
Monthly Profit = (Guests × Average Check × Profit %) – Fixed Costs
Breakdown:
- Guests = how many people you serve.
- Average Check = what the typical guest spends.
- Profit % = what’s left after food + variable labor + variable costs.
- Fixed Costs = rent, base salaries, insurance, etc.
Most owners stare at sales (Guests × Average Check) but ignore Profit % and Fixed Costs.
Step 2: Get Your True Profit %
Your Profit % (operating margin) is:
Profit % = (Sales – COGS – Labor – Operating Expenses) / Sales
But to make this simple, focus on:
- Food Cost %
- Labor Cost %
- Prime Cost % = Food + Labor as % of Sales
Want to know what profit margin you should aim for? Healthy ranges (will vary by concept, but as a rule of thumb):
- Food Cost %: 25–32%
- Labor Cost %: 25–35%
- Prime Cost %: Under 60% is the line we see top performers hold.
In our dataset, units that consistently kept Prime Cost under 60% were 4.3x more likely to hit an 10%+ net operating profit than those above 65%.
Step 3: Tie the Formula to Real Levers
Let’s now connect the formula to the
- Guests: driven by brand, demand, loyalty, marketing, location, and throughput.
- Average Check: driven by menu design, price power, upselling, and perceived value.
- Profit %: driven by menu mix, food cost, labor efficiency, and waste.
- Fixed Costs: mostly driven by your lease and structure.
What we’ve seen in most independent restaurants:
- Operators obsess with Guests (traffic) but are weak on profit %, which leads to burnout.
- Operators obsess with cutting costs but by never increasing Average Check they essentially cap their upside.
The winners though, consistently align all three: More of not any guests but the right guests that spend more on high-margin items, with lean prime cost.
Step 4: Use the Profit Stack Method™
In our Profit Stack Method™ we use a 5-step sequence:
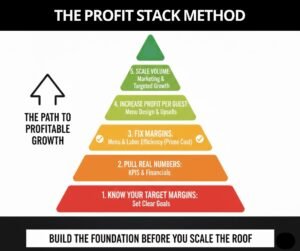
- Know Your Trarget Margin Bands – Here’s the hard truth: good food doesn’t automatically mean good profit. And guessing your “target margin” doesn’t help. Start with realistic net profit bands—after you pay yourself a market-rate salary.
- Pull Your Real Restaurant Numbers – If you can’t pull last month’s key KPIs, you’re not running a business—you’re running on hope. Fix the numbers first. Marketing comes later.
- Compare Your Numbers to Benchmarks – See where you stand. If you’re not benchmarking, you’re guessing. And guessing is costly. See how you stack up.
- Find What’s Actually Holding You Back
- Prime Cost % too high? Fix the menu, recipes, and schedule.
- Seat revenue too low? Fix throughput, demand, or check size.
- Overhead too heavy? Rent, debt, or too much management is the anchor.
- Choose the Right Margin Plays—in the Right Order
Most operators try everything at once. That’s why nothing sticks. More ideas won’t save you. You don’t need 20 ideas—you need 3–5 key plays. If the math doesn’t work, all you need to do is to fix the levers before chasing more traffic.
And when you’re cutting costs, here’s a playbook to reduce operating expenses without hurting service — without breaking the guest experience.
CASE STUDY: NATIONAL BRAND-STYLE GRILL
This case study is built from dozens of casual dining units that had almost the same pattern. If you own a grill, bar & grill, or bistro, this will feel familiar.
Restaurant Type: Casual dining, scratch kitchen
Location: Suburban market
Seats: 120
Problem Identified:
- “We’re busy but there’s never cash left at the end of the month.”
- Average monthly sales: $260,000
- Net profit: 2–3% in a good month, sometimes negative.
Step 1 – Plug into the Formula
- Guests / month: ~7,200
- Average check: $36
- Food Cost %: 33%
- Labor Cost %: 35%
- Prime Cost %: 68%
- Fixed Costs (rent, salaries, etc.): $55,000/month
On paper, they thought, “We just need more guests.” But the formula said: “More guests at this cost structure = more stress, not more profit.”
Step 2 – Fix Margin First
What was implemented? Focused on 3 fast moves:
- Menu Engineering (Factors: Menu Simplicity/Focus & Price Optimization)
- Cut 18 low-margin, slow-moving items (menu shrunk by 28%).
- Replaced with 6 high-margin, faster-prep items.
- Moved two high-margin dishes to hero positions on the menu.
(For what chefs expect guests to chase next, reference the National Restaurant Association — What’s Hot Culinary Forecast).
- Labor Scheduling (Factor: Operational Simplicity)
- Used sales by hour to reshape schedules.
- Removed 12–15 “dead” labor hours per weekday.
- Added cross-training to handle spikes with fewer people.
(Hiring, onboarding, and workforce tech adoption is covered in the National Restaurant Association—Workforce Technology Report.)
- Portion Control & Waste (Factor: Operational Simplicity)
- Standardized portions with portion tools, not eyeballing.
- Tightened ordering and prep to match actual demand.
What Was Achieved Within 90 days:
- Food Cost %: 33% to 29%
- Labor Cost %: 35% to 31%
- Prime Cost %: 68% to 60%
Step 3 – Increase Profit per Guest
- Created 3 high-margin bundle offers.
- Added simple server prompts: “Would you like to add X for just $Y more?”
- Average check: $36 to $39.50 without heavy discounting.
Step 4 – Then Scale Volume
Once Prime Cost stabilized and profit per guest was up:
- Launched local partnerships and small paid campaigns.
- Guests/month: 7,200 to 8,100 over 4–5 months.
Results after 6 months:
- Sales: $260,000 → $319,000/month
- Prime Cost %: down from 68% to 59–61% range
- Net profit: 2–3% to 14–16% (average)
So clearly, the magic wasn’t “more marketing.” It was running the business through a simple profit formula and aligning menu, labor, and volume behind it.
KEY MISTAKES: WHAT TO AVOID
If you want the extended “red flag” checklist, these are the most common profit margin killers we see across concepts. But in general, here are the patterns we see again and again:
-
Chasing traffic before fixing margins
- “We need more customers.” No, you don’t. Not if every customer loses you money. More customers just means bigger losses.
-
Scheduling from gut instead of data
- No clear target like “Covers per labor hour.”
- Just “this feels like a Friday, let’s staff heavy.”
-
Letting staff eyeball portions
- Most of the time a problem ignored by operators, but this alone can swing food cost 4–6 percentage points.
-
Keeping low-margin favorites “because guests like them”
- If they don’t carry their weight in the profit formula, they’re slowing you down.
-
Assuming more sales automatically means more profit
- If your prime cost is broken, busy can be even more dangerous than slow.
-
Using marketing to hide operational gaps
- Discounting to drive traffic while bleeding on the back end.
If you hear yourself in any of these, don’t beat yourself up. Just decide you’re going to run the restaurant from numbers, not emotion.
KEY METRICS: THE NUMBERS THAT MATTER
Here are the key formulas you should know and use:
Food Cost %
Food Cost % = COGS / Food Sales
Example: $78,000 COGS ÷ $260,000 food sales = 30% food cost.
Labor Productivity
Labor Productivity = Covers / Labor Hours
Example: 7,200 covers ÷ 1,800 labor hours = 4 covers/hour.
Labor Cost %
Labor Cost % = Total Labor Cost / Sales
Contribution Margin per Dish
Contribution Margin = Selling Price – Cost per Dish
This tells you how much each sale contributes to covering fixed costs and profit.
Prime Cost %
Prime Cost % = (COGS + Labor) / Sales
Aim to keep this in the high 50s / low 60s depending on your concept.
Throughput
Throughput = Guests served per hour per station
This is how fast your “machine” can actually run without breaking.
Monthly Profit (simple view)
Monthly Profit = Sales – (COGS + Labor + Operating Expenses + Fixed Costs)
Try to track these weekly. Put them on the wall. Talk about them in pre-shift. Reward behaviors that move these numbers in the right direction.
TURN IT INTO A SYSTEM: MEASURE, FIX, REPEAT
Here’s a simple checklist to keep this from becoming “just another article”:
- Write your simple formula on a whiteboard:
Profit = Guests × Avg Check × Profit % – Fixed Costs
- Pull last month’s data and fill in each piece.
- Calculate your Food Cost %, Labor Cost %, and Prime Cost %.
- Circle the weakest link – the biggest constraint to your business: food, labor, or average check.
- Pick the leak: menu, scheduling, training, or waste. Write three fixes. Hit them hard.
- Set a weekly review: 30 minutes with your key people.
- Stop launching new promos until the formula starts working in your favor.
- Recalculate profit impact before any new big decision.
If your team can’t explain your profitability formula in one sentence, they’re guessing. See, we want everyone pulling in the same direction.
THE SCRIPT FLIP THAT CHANGES EVERYTHING
We’ve watched it over and over: you don’t win by outworking everyone and overstressing the system. You win by removing chaos from the system.
-
Systems beat talent.
If your best server quits, the machine should still work.
-
Numbers beat guessing.
If you feel “busy but broke,” look at the formula. It will tell you why.
-
Consistency beats effort.
It’s better to run a good system every day than chase heroic saves on Friday night.
When you start thinking this way, you stop asking, “Are we busy?” and start asking: “How much profit are we making per hour of being open?” That’s when things change.
THE 6-STEP ACTION PLAN
Here’s your simple 7-step action plan. Just follow it, and results will show fast.
- Write down the formula and share it with your team.
- Pull last 3 months of P&Ls and calculate:
- Guests
- Average check
- Food Cost %
- Labor Cost %
- Prime Cost %
- Monthly profit
- Identify your weakest lever (margin, check, or volume).
- Fix margin first (menu + labor) until Prime Cost is in a healthy range.
- Increase profit per guest with menu design and simple upsells
- Treat the menu as one of your biggest profit levers (not just a list of items) – see why menu is your most powerful asset according to Modern Restaurant Management.
- Then scale volume with targeted growth strategies like location visability, special attractions, events and promotions, and partnerships.
FREQUENTLY ASKED QUESTIONS (FAQ)
Q1: My sales are up but I still have no cash. Where do I start?
Start with Prime Cost. If food + labor are too high, more sales can actually make things worse. Fix food cost %, labor efficiency, and menu mix before chasing more guests.
Q2: What’s a “good” profit margin for a restaurant?
It depends on your concept, but from our restaurant dataset, consistently healthy operators tend to land 12%+ net operating profit margin once the system is tuned. The important thing is that you know your current % and what’s breaking it.
Q3: Should I raise prices to fix my profit?
Maybe. But if you only raise prices and don’t fix portion control, waste, and your menu mix, you’ll still be leaving a lot of money on the table.
Q4: How often should I run the profitability formula?
We advise operators do this at least once a week. High-performing operators treat it like a health check. Small weekly tweaks beat one big panic meeting every three months.
FINAL THOUGHTS
You’ve just seen how a simple profitability formula
The plays we walked through – fixing Prime Cost, engineering your menu around contribution margin, improving profit per guest before pushing volume – work. High-performing operators don’t guess which lever to pull next. They assess, prioritize, and optimize across multiple drivers in the right order.