

Here’s the uncomfortable restaurant profit question I ask owners when they tell me, “We’re busy… but the bank account doesn’t show it.” If you’re selling more food than ever, why do you feel more broke than ever?
You can feel it in your bones when a restaurant is stuck. The dining room is full, tickets keep printing and the team is moving, but then Monday hits. Vendors want their money, payroll is due and the tax account is short. You start doing the same math you do every week: “How are we this busy… and still this tight?”
We’ve analyzed thousands of restaurant operations at RevenueHawk — P&Ls, schedules, menu mixes, inventory counts, void logs, ticket times, and the little daily habits that either make or break your restaurant.
And we consistently see one pattern show up again and again: most owners don’t have a sales problem. They have a profit system problem.
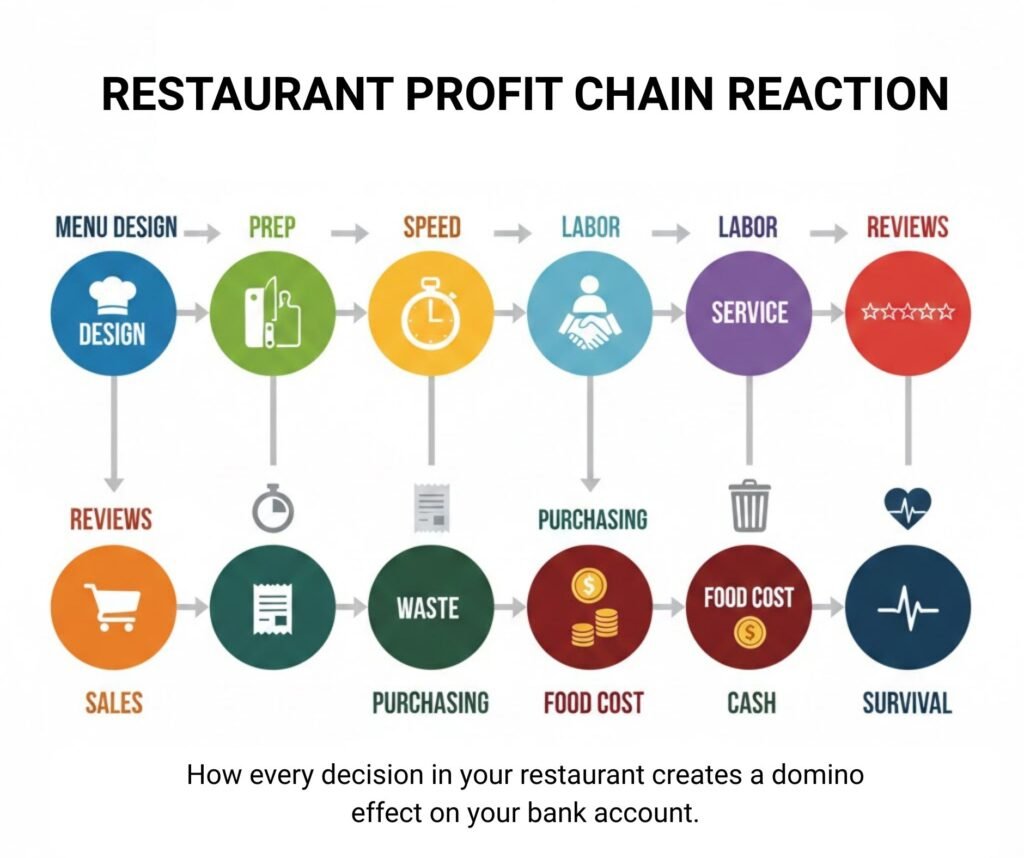 Look, restaurants aren’t one problem at a time. They’re a chain of connected parts:
- Menu design affects prep
- Prep affects speed
- Speed affects labor
- Labor affects service
- Service affects reviews
- Reviews affect sales
- Sales affect purchasing
- Purchasing affects waste
- Waste affects food cost
- Food cost affects cash
- Cash affects survival
If you don’t do the right move and pull the wrong lever, you don’t just “miss” profit — you create chaos.
That’s why benchmarks matter. Because they give you a target, a reality check, and a way to spot leaks early.
We’ll start with one simple anchor: the margin targets you should aim for. And this is not because a benchmark magically fixes anything — but because without a target, you can’t tell if you’re improving or just working harder.
Here’s the blunt truth: most restaurants don’t fail because the owner didn’t care. They fail because the owner didn’t have a clean system to turn effort into profit. Across the many cases we’ve seen, we’ve learned that having a sound system in place is the difference between surviving and winning.

KEY POINTS: WHAT YOU’LL LEARN
- How to build real restaurant profit: Think about profit like an engineer — not a gambler. Build a system that produces margin on purpose.
- Why it matters: Volatile food and labor costs demand tighter controls, faster decisions, and better weekly management—not “end-of-month hope.”
- Real example: A case-study style breakdown with a real-world structure you can copy (menu changes, labor tweaks, and the margin lift).
- Mistakes to avoid: How to navigate key challenges and constraints without harming quality or guest experience.
- Metrics you need: The numbers that keep you on top of your game — the weekly (not monthly) formulas you should track to stay in control.
- How to make it last: A simple checklist that locks improvements in so results don’t fade after two good weeks.
- The reset you need: Profit isn’t luck—it’s design. Start looking at your restaurant as a system you can measure, adjust, and optimize.
- The action plan: A clear set of steps to execute over the next 30 days (what to review, what to change, and what to monitor weekly).
WHY THIS MATTERS
Let’s be clear here: costs didn’t simply go up. They got messy — jumping around, hitting from different angles, and breaking old budgets.
- Food costs swing according to USDA ERS Food Price Outlook.
- Labor is harder to hire and even harder to keep.
- Delivery and third-party fees keep pulling margin out of your pocket.
- Guests now notice value more than ever. McKinsey report confirms that value and pricing remain at the forefront of consumers’ minds.
- A small service mistake can quickly turn into a negative review.
Big brands have reacted by building tighter systems — not by “trying harder.”
- Chick-fil-A doesn’t rely on heroic staff. They rely on flow.
- Domino’s doesn’t depend on one great manager. They depend on process.
- Starbucks doesn’t guess demand. They model it.
- Texas Roadhouse doesn’t win because of one trick. They win because they execute the same standards every day.
Meanwhile, many independent restaurants still do this:
- They review numbers monthly, which is too late.
- They schedule based on gut which most of the time turns to be expensive.
- They treat menu changes like creativity but that leads to chaos.
- They treat “busy” like success — that’s dangerous.
Often operators end up living inside in a problem where sales are up, but profits aren’t. This happens because sales are only the top of the funnel. Profit is what’s left after the system does its job.
And when the system is messy, higher sales can actually make you feel worse:
- more labor stress
- more waste
- more comped meals
- more overtime
- more mistakes
- more equipment wear
- more inventory swings
So yes — this matters now, and it matters a whole lot. Because the restaurants that survive the next decade won’t be the “coolest.” They’ll be the best managed, the most controlled, with the most repeatable model. Here is how 2026 will impact restaurant winners and losers as highlighted by Restaurant Dive.
THE RESTAURANT PROFIT BLUEPRINT: STEP-BY-STEP HOW TO BUILD REAL PROFIT
Top operators understand that order matters. If you try to “save money” before you understand where it’s going, you’ll cut the wrong thing and damage service. If you try to “get more customers” before your margins are stable, you’ll scale stress.
So we start with showing you how to build the foundation.
Step 1: Build Your Restaurant Profit Map (so you stop guessing)
Your accounting system tells you what happened last month whereas your profit system tells you what will happen next week.
You need a simple profit map made of three layers:
- Menu Layer (what you sell and what it really earns)
- Labor Layer (how efficiently you produce and serve it)
- Ops Layer (waste, purchasing, and overhead control)
Most restaurants try to fix Layer 3 first (“let’s cut expenses”) because it feels easy. But our experience shows that if Layers 1 and 2 are broken, Layer 3 won’t save you.
Step 2: Stop treating restaurant profit like one number
Most owners we talk to love to ask, “What’s a good profit margin?” It’s a fair question, but it’s also a trap—because it can make you ignore the parts that create that margin. Profit margin isn’t one lever.
It’s the result of many small levers working all together. That’s why we use a profit stacking approach in audits. Think of it like this: You don’t need one giant fix.
You need 6–10 small fixes that each add 0.3% to 1.0% margin. That’s how you really build boring, predictable profit.
Here are the typical “profit stacks” we see move the needle fastest:
- Portion control: +0.5% to +1.5%
- Waste reduction: +0.5% to +1.0%
- Menu engineering (pricing + mix): +0.5% to +2.0%
- Scheduling accuracy: +0.5% to +1.5%
- Speed / throughput improvements: +0.5% to +1.0%
- Comp/void control: +0.2% to +0.8%
- Vendor discipline and price drift checks: +0.2% to +0.7%
Individually, these don’t sound exciting, but together, they can change your life.
Step 3: Lock your weekly scoreboard (the one that actually matters)
If you only look monthly, you’re always late. A restaurant can bleed profit for 21 days and still look “fine” on a monthly report. Weekly is where you can actually get things in your hands. Really.
Here’s the “RevenueHawk Weekly Scoreboard” we recommend:
- Weekly sales (split lunch/dinner if you can)
- Covers
- Average check
- COGS estimate (even if rough)
- Labor hours + labor $
- Prime cost %
- Top 20 items by units sold
- Top 20 items by profit dollars (not just popularity)
- Comps/voids/discounts as a % of sales
- Notes: waste, overtime, big issues
The goal here should not be perfect accounting. The goal should be receiving fast feedback.
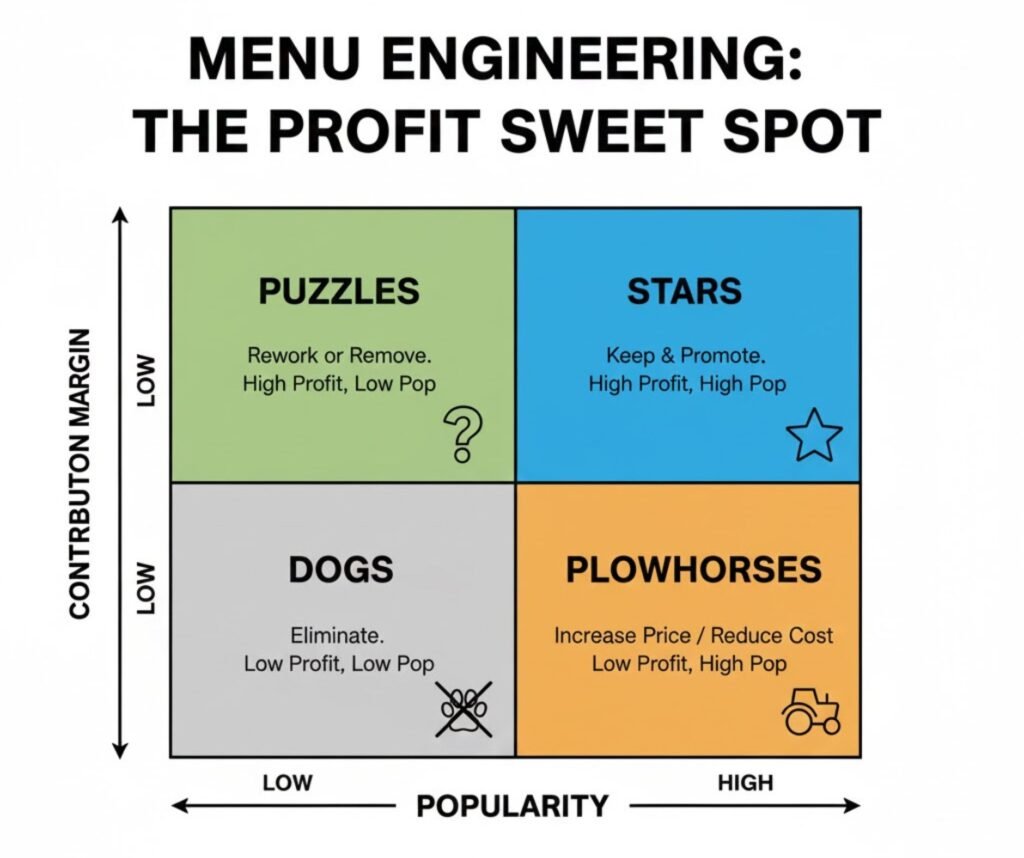
Step 4: Fix your menu for execution, not just taste
A menu is not a list of things you can cook. A menu is a precise production plan.
When your menu is too big or too mixed, it creates:
- longer training
- slower tickets
- more prep waste
- more inventory
- more mistakes
- more “86” moments
- more labor hours to keep up
A clean menu does the opposite:
- less prep
- fewer SKUs
- faster line
- tighter portions
- better consistency
That’s why we see menu changes often fix labor problems without “cutting staff.” Because when the kitchen is easier to run, one hour of labor produces more guests served.
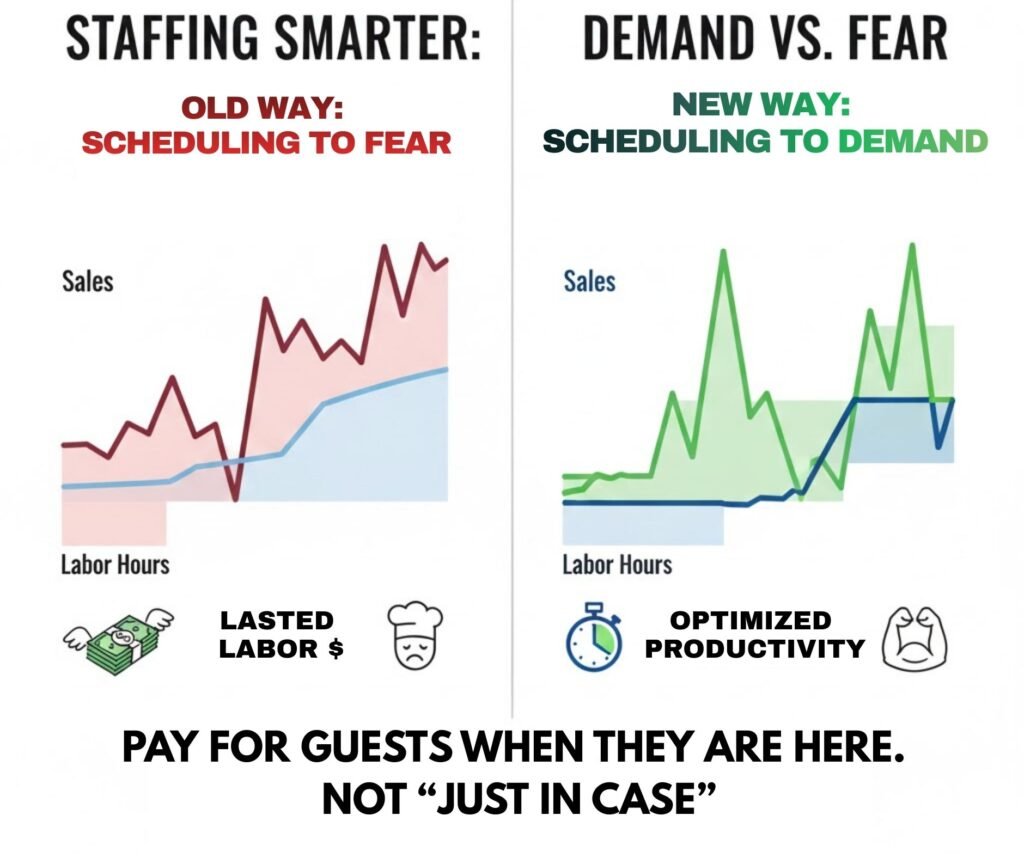
Step 5: Schedule to demand, not to fear
We see this all the time: independent operators overstaff in the name of safety—adding extra bodies “just in case.” The problem is that “safe” gets expensive fast, especially as industry-average hourly earnings keep rising as reported by the U.S. Bureau of Labor Statistics. And it quietly lowers standards, because it trains your team to work slower.
Here’s a better way — simple, clean and repeatable:
- Forecast demand using last 6–8 weeks
- Staff to the forecast
- Assign clear roles during rush
- Address throughput bottlenecks
- Cross-train one flex role
- Review results weekly
When restaurants do this consistently, labor stops feeling like a monster.
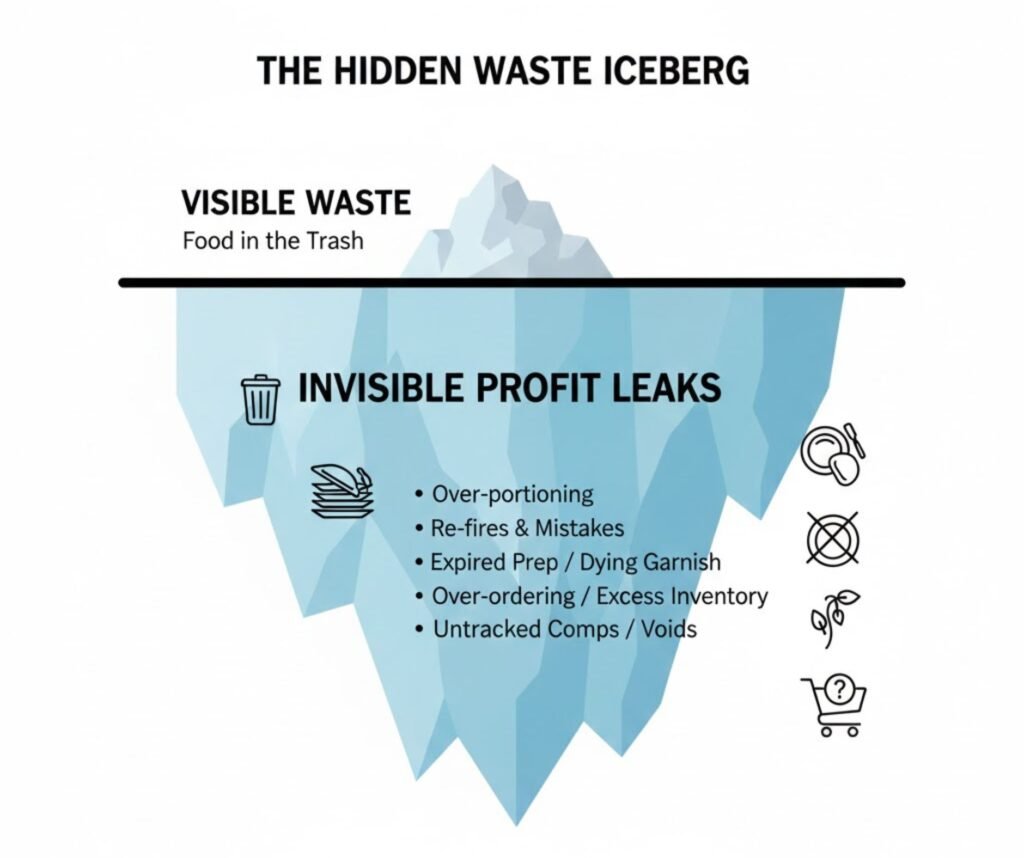
Step 6: Attack waste like it’s stealing from you
Let’s talk about waste now. Most people think that waste is only “food thrown away” — but waste is much more than that.
Waste is also:
- re-fires
- wrong orders
- over-portioning
- dying garnish
- unused prep
- poor rotation
- over-ordering “just in case”
- making too many specials nobody buys
If you don’t track waste, you will underestimate it. In most restaurants we see, the owner underestimates it by a lot.
Here is a simple start:
- every day, track and write down what got thrown out
- why it happened
- what rule would prevent it next time
Remember: rules beat lectures.
Step 7: Control overhead, but don’t cut service
We’ll go deeper later, but here’s the key: If you cut the guest experience to save money, you’ll lose the only thing that brings money in.
Instead, you should aim to cut:
- friction
- duplication
- unused tools
- sloppy purchasing
- hidden fees
- “we’ve always done it this way” costs
That’s how you grow profit. Not by panic cutting.
CASE STUDY: A REAL EXAMPLE (KNOWN RESTAURANT MODEL)
Here is a structured example based on patterns we’ve seen in restaurants with a similar casual-dining footprint and workflow to Olive Garden (high volume, family dining, repeatable menu, heavy weekends).
Restaurant Type: Casual dining (Italian-American, high-volume dinner business)
Location: Suburban market
Seats: 210
Problem Identified: Great weekend sales, weak weekly profit, rising labor stress
What Was Implemented: Menu execution cleanup, labor planning and waste controls
Results: Margin up, fewer comps, smoother rush, more stable cash flow
What the operator thought the problem was
The GM said:
- “Food costs are high.”
- “Labor is killing us.”
- “Guests are getting pickier.”
All valid… but not the root.
What the numbers actually showed
The real pattern was this:
- Strong Friday–Sunday sales
- Weak Monday–Thursday contribution
- Lots of prep waste midweek
- Too many “slow-selling” menu items still being prepped
- Scheduling built around “what we usually do,” not actual covers
- Big comp/void spike on weekend rushes due to mistakes and delayed tickets
So, in plain English: The system couldn’t handle its own volume cleanly.
What was implemented to boost restaurant profit (in the order shown below)
1) Menu execution cleanup
Remove complexity from the kitchen:
- Trimmed the number of items that required unique prep steps
- Consolidated SKUs (fewer one-off ingredients)
- Reduced prep that didn’t sell midweek
- Standardized plating steps on the top sellers
Result: fewer touches per ticket.
2) Portion standards on high-cost proteins
This is where we see a lot of restaurants quietly bleed:
- Same dish, same name, same price…
- but portions vary based on who’s on the line
There was clearly a need to tighten:
- portion tools
- build cards
- manager spot checks
- retraining sprint
Result: less volitile and much more predictable COGS.
3) Build labor precisely around demand
Schedule “smart” Instead of scheduling “safe”:
- Forecasted covers by daypart
- Built a staffing grid
- Assigned clear rush roles
- Cross-trained a flex position (helps where pressure builds)
Result: less overtime, fewer “too many cooks” moments, faster tickets.
4) Comp and void discipline
Create rules:
- manager approval required over a certain comp amount
- comp reasons categorized (late ticket, wrong item, guest recovery)
- weekly review of top comp causes
Result: fewer repeat mistakes, less “silent loss.”
Outcomes after 8–12 weeks (what typically moves first)
In this kind of operation, the first wins usually look like the following:
- lower waste midweek
- fewer weekend comps
- steadier food cost
- smoother service (because the line isn’t drowning)
- tighter labor hours (without harming service)
And the big lesson is: A full dining room doesn’t pay you. Only a well controlled system does.
MISTAKES: WHAT YOU MUST AVOID
If you’re honest, you’ve probably done some of these. Most owners we work with have.
Mistake #1: Rely on volume trying to “out-sell” bad margins
You can’t market your way out of a math problem.
Mistake #2: Fixing symptoms instead of causes
“Labor is high” is usually a symptom.
Common causes:
- menu complexity
- slow ticket times
- bad prep planning
- too many voids/re-fires
- training gaps
- unclear stations and roles
Mistake #3: Keeping low performers because they “complete the menu”
Don’t treat your menu like a museum. If it doesn’t sell and it doesn’t earn, it should change.
Mistake #4: Letting the kitchen run on memory
Memory is not a standard, and certaintly not the way to go. Replace memory with standards: portion tools, build charts, and daily checks.
Mistake #5: Thinking “pricing” fixes everything
Pricing helps when it matches real costs and real value. But if waste and portions are loose, higher prices just hide the leak for a moment.
Mistake #6: Ignoring the usual suspects
In our audits, the same list comes back like a bad song. The most common margin killers usually include things like:
- too many menu items
- uncontrolled portions
- weak purchasing discipline
- high waste
- labor scheduled wrong
- low-margin best sellers
- discount/comp creep
- no weekly review habits
If you’re trying to improve profit and you aren’t directly attacking these, you’re playing on hard mode.
METRICS: THE RESTAURANT PROFIT NUMBERS THAT MATTER (SIMPLE FORMULAS)
1) Food Cost %
Food Cost % = COGS / Food Sales
Example:
- COGS = $18,000
- Food Sales = $60,000
$18,000 ÷ $60,000 = 0.30 = 30%
This tells you: how expensive your food is compared to what it earns.
2) Labor Productivity
Covers per Labor Hour = Total Covers / Total Labor Hours
Example:
- 2,400 covers
- 1,200 labor hours
2,400 ÷ 1,200 = 2.0 covers per labor hour
This tells you: how efficiently your team turns labor into guests served.
3) Prime Cost %
Prime Cost % = (COGS + Labor) / Sales
Example:
- COGS $18k + Labor $22k = $40k
- Sales $80k
$40k ÷ $80k = 0.50 = 50%
This tells you: your main controllable cost block.
4) Contribution Margin (per dish)
Contribution Margin = Selling Price − Cost per Dish
Example:
- Dish price = $18
- Dish food cost = $6.50
18 − 6.50 = $11.50
This tells you: how much money the dish leaves behind to pay labor and overhead.
And this is where we see so many owners get trapped…
The most misunderstood concept in restaurant finance
Many owners obsess over food cost % and miss the bigger point: the contribution margin
Here’s why this matters:
Two items can both have a 30% food cost.
But one sells for $30 and the other sells for $12.
- 30% of $30 = $9 cost and $21 left
- 30% of $12 = $3.60 cost and $8.40 left
Which item you think pays your rent faster? The $30 item of course.
So next time when you engineer the menu, you don’t just ask:
- “What’s the food cost %?”
You ask:
- “How many profit dollars does this dish contribute?”
- “How much labor does it require?”
- “How often does it cause mistakes?”
- “How fast can we execute it during rush?”
That’s how grown-up menu decisions get made.
5) Throughput
Throughput = Guests served per hour per station
This is huge because it affects:
- labor hours
- ticket times
- table turns
- guest satisfaction
If your throughput is low, your labor % will usually be high. And we see so many operators try to “cut labor” instead of “fix throughput.” That’s backward thinking.
MAKE IT LAST: YOUR CHECKLIST FOR OPERATIONAL CONSISTENCY AND MORE RESTAURANT PROFIT
Most restaurants already know what to do. The missing piece is doing it every single day for maximum results.
Here’s how you can turn improvements into lasting habits in real operations.
Daily habits (10–20 minutes, no excuses)
Manager open:
- Check pars (what should be prepped today?)
- Check inventory on high-cost items (proteins, cheese, oils)
- Check portion tools are in place (scales/scoops)
Before rush:
- 5-minute station talk:
- what’s selling today
- what’s 86 risk
- who is flex support
- where bottlenecks usually happen
During rush:
- Manager watches 5 plates/builds quietly
- If a portion is off, correct it instantly (not later)
End of day:
- Note waste (what got tossed and why)
- Note comps/voids (what happened and why)
- Note any “slowdowns” (what caused delays)
Weekly habits (60 minutes that changes your income)
- Review prime cost %
- Review top sellers and their contribution margin
- Review schedule vs actual sales/covers
- Review waste notes
- Review comps/voids by reason
- Pick 1–2 changes for next week
Don’t go for 12 changes. Don’t try to do a huge “reset.”
Focus on only one or two changes at a time. Small wins, stacked, are how you build a strong, profitable operation.
Track the costs most operators forget
This is where restaurant profit disappears quietly: behind the hidden costs operators forget to track.
These often show up as:
- Discounts/comps that slowly become normal
- Overtime creep (or “almost overtime” that still burns you)
- Spoilage and over-prep (especially midweek)
- Fees (processing fees, third-party fees, random service fees)
If you track these weekly, you stop getting surprised. Surprises can be costly, and in a low-margin business, they can cause significant hiccups and strain on operations and cash flow.
THE SHIFT THAT COULD CHANGE EVERYTHING FOR YOUR RESTAURANT
Here’s the belief that changes everything: Profit is not what happens when you work harder. Profit is what happens when you remove chaos.
Many owners we work with often think: “If we just make the food even better, profit will follow.” Sometimes it helps, but it’s not a guarantee.
One thing should be very clear: good food doesn’t guarantee profit. Even great food inside a messy system still loses money.
The five reasons show up like clockwork:
- the menu is too complex to execute consistently
- portions aren’t controlled
- waste is “normal”
- labor is scheduled wrong
- pricing and mix don’t support overhead
So the shift to make is this:
- You don’t win by working harder — you win by removing chaos.
- Systems beat talent.
- Numbers beat guessing.
- Consistency beats effort.
If your restaurant is exhausting, it’s usually because the system is loose. Just tighten the system, and the restaurant gets lighter.
ACTION PLAN: WHAT TO DO NEXT (30 DAYS, IN ORDER)
Here’s the 30-day plan we recommend to operators to build momentum.
Below is the simple version we’d hand to an owner right after an audit.
Days 1–7: Build your baseline
- Pull your last 8 weeks of financials:
- sales
- COGS
- labor
- operating expenses
- Calculate weekly averages:
- prime cost %
- labor hours per $1,000 in sales (simple productivity check)
- Identify:
- top 20 sellers
- top 20 profit items (profit dollars, not popularity)
- bottom sellers that still create prep
Goal: stop guessing. Use real data to make decisions.
Days 8–14: Tighten portions and waste
- Put portion tools where they can’t be ignored
- Create build cards for your top sellers (pictures help)
- Tighten prep pars for midweek
- Track waste daily
Goal: stop the bleeding.
Days 15–21: Fix scheduling to demand
- Forecast sales by daypart using history
- Build a staffing grid
- Add one flex role during peaks
- Track covers per labor hour weekly
Goal: stop paying for fear. Pay for labor only when demand is real.
Days 22–30: Control overhead without hurting service
This is where most owners mess up. They cut the wrong thing and hurt the guest.
Instead, learn how to reduce operating expenses without hurting service.
A few examples of “safe” cuts:
- consolidate vendors and negotiate delivery minimums
- reduce SKU count (less money trapped in inventory)
- prevent equipment abuse with simple cleaning/closing standards
- reduce re-fires by tightening expo and ticket flow
The rule is simple: Cut costs that guests don’t feel. Don’t cut the parts guests pay you for.
FREQUENTLY ASKED QUESTIONS (FAQ)
Q1: What benchmarks should I look at first?
We advise operators to start with prime cost %, then look at your top sellers’ contribution margin, then labor productivity. Those three will usually reveal where the leak lives.
Q2: How often should I check numbers?
Weekly for core metrics. Daily for waste and comps. Monthly for deep overhead review. Yearly for big strategy.
Q3: Should I remove menu items that guests love?
If they love it and it makes money, keep it. If they love it and it loses money, rework it: change portion, price, ingredients, or execution steps. “Love” alone doesn’t pay rent.
Q4: What if my restaurant is seasonal?
Even more reason to track weekly. Seasonality punishes slow reactions. Weekly tracking lets you adjust faster.
FINAL THOUGHTS
You’ve now seen several proven plays how to improve restaurant profit pulled directly from our dataset . Each one works — but they represent only a small part of the Restaurant Growth Engine — our 16-factor revenue system that separates predictable growth from flat performance.
Here’s what high-performing restaurants do differently:
They don’t “try things.” They assess, prioritize, and optimize across multiple factors in the correct sequence.
They don’t chase profit like it’s a mystery. They build profit like it’s a machine.
So if your restaurant is busy but still tight, don’t panic.
Run the blueprint:
- lock the scoreboard
- stack small wins
- engineer the menu for execution
- schedule to demand
- kill waste
- protect service while tightening overhead
- repeat weekly
That’s how you stop living month-to-month. That’s how you turn “a packed dining room” into “a paid owner.” And that’s the whole game.