

Here’s the uncomfortable truth: most restaurant profit margin problems don’t start on the P&L. They start in the way the restaurant is built and run as a system.
At RevenueHawk, we’ve analyzed 3,500+ U.S. restaurants. What we saw over and over is that profitable restaurants aren’t just “better operators” — they’ve aligned multiple revenue drivers at the same time: menu, pricing, labor, floor layout, marketing, and guest flow to achieve an impressive restaurant profit margin.
When units struggle with low profit margins, the owner usually blames one thing:
- “Labor is killing me.”
- “Food costs are out of control.”
- “Marketing isn’t working.”
- “Delivery apps eat all the profit.”
But when we score those same restaurants across our 16-factor Restaurant Revenue Power Evaluator™, the pattern is clear: they’re not being killed by one problem — they’re being drained by 5–8 small leaks that add up.
For example: in restaurants where net profit was under 5%, we almost always saw 3+ of these areas scoring low at the same time:
- Key Differentiator / Niche Concept
- Menu Simplicity
- Price Level Optimization
- Operational Simplicity (Labor Productivity, Throughput & Table Turns)
- Channel Mix (dine-in vs delivery vs takeout)
Here’s the truth we’ve seen again and again: growth and profit don’t come from “one big fix.” They come when you find the real system leaks and key constraints for your business, fix them in the right order, and stop the slow bleeding. If you want the bigger framework behind that system thinking, start with our restaurant profitability blueprint.
Use the tool below to see how well your restaurant is using the same revenue drivers top brands rely on — and how much profit you might be leaking every month without realizing it.

KEY POINTS: WHAT YOU’LL LEARN
By the end of this article, you’ll know:
- The 8 most common profit margin killers we see across restaurants and step-by-step way to find your own leaks and fix them.
- Why they show up together and why you need a system (fixing just one rarely moves the needle).
- The key mistakes operators make and how to avoid them
- The metrics that matter (and the simple formulas to track them).
- The mindset you need to shift from “work harder” to “design a better system.”
WHY THIS MATTERS (PROTECT YOUR RESTAURANT PROFIT MARGIN)
Let’s be blunt.
Although the longer-term trend in spending away from home is positive and rising in the aggregate Federal Reserve Economic Data (FRED) data, the gap between winning and losing restaurants has never been wider:
- Big brands like Chipotle, Chick-fil-A, McDonald’s, Texas Roadhouse keep finding ways to protect margins even with higher wages and rising costs.
- How do they do it? They simplify menus, tighten operations, engineer pricing, and design for throughput. They treat profit as a system, not a “hope it works this month” number.
Meanwhile, we see many independents that are stuck:
- Raising prices randomly to chase food cost.
- Cutting staff and hurting service to “fix labor.”
- Throwing more money at marketing while bleeding profit on every extra cover.
Most owners are not lazy and not dumb, but unfortunately they’re just fighting the wrong enemy. (This is also the core of why “good food” alone doesn’t guarantee profit — quality matters, but the margin system decides the outcome.)
They’re trying to:
- “Sell their way out” of broken margins.
- Patch symptoms instead of fixing root causes.
- Treat each problem in isolation instead of seeing the full system.
That’s why this article matters now: If you don’t identify and remove your margin killers, more sales will only grow your stress, not your bank account. If that line hits home, here’s the deeper breakdown of why sales can be up while profits aren’t. For an up-to-date view of comparable sales and traffic by segment, refer to the latest monthly trend brief from Black Box Intelligence.
STEP-BY-STEP: THE 8 MOST COMMON RESTAURANT PROFIT MARGIN KILLERS (AND HOW TO FIX THEM)
We’ll go through each killer, what it really is, and how to fix it.
Killer #1: A Bloated, Confusing Menu
What it looks like:
- 60–120+ items.
- Multiple prep methods, sauces, and build types.
- Low-selling items still on the menu “because someone might order them.” Even large brands are still getting punished for complexity and pricing missteps, according to Restaurant Dive.
Why it kills your profit:
- More menu items = more waste, more spoilage.
- More complexity = slower training, more mistakes, slower ticket times.
- Harder to staff the line and maintain consistency.
Across our dataset, restaurants with very complex menus had, on average, 3–5 points higher food cost and 10–20% lower labor productivity than similar concepts with tight menus.
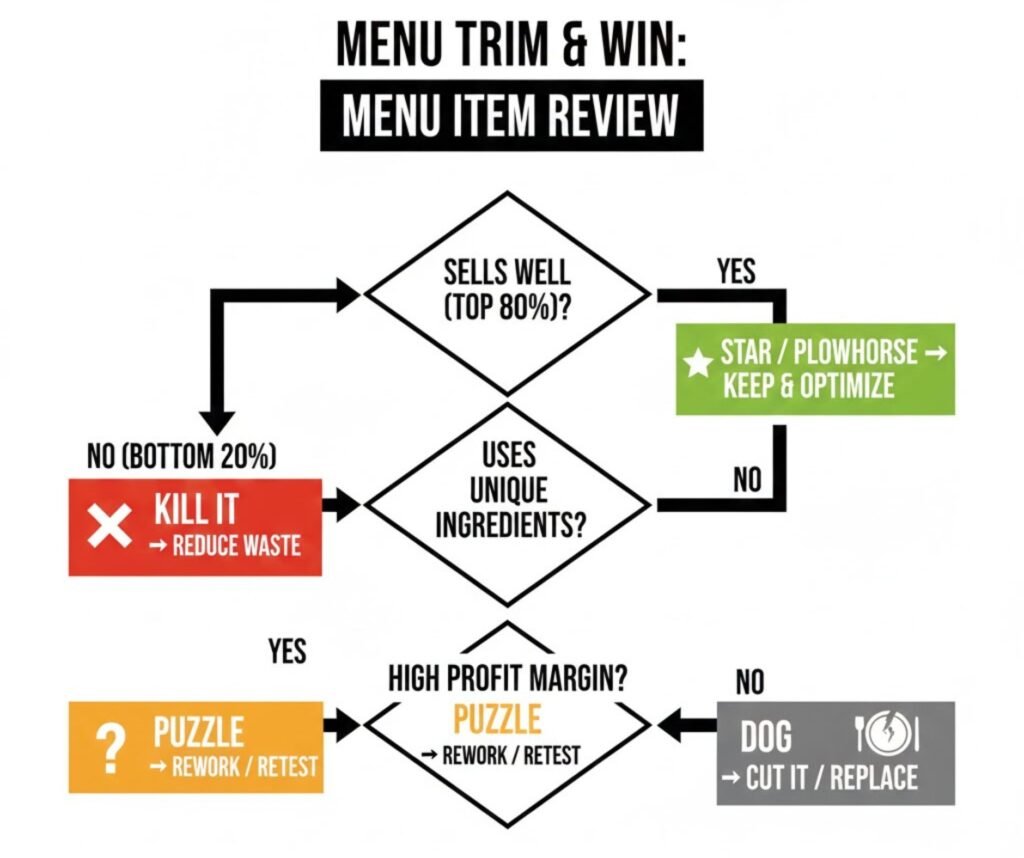
How to fix it:
- Pull the last 3–6 months of sales.
- Mark the bottom 20–30% of dishes by sales volume.
- Cut or rework anything that:
- Sells rarely
- Uses unique ingredients that no other dish needs
- Aim to reduce your menu by 20–30%.
- Re-train your staff around a smaller menu so they can move faster and upsell better.
Killer #2: Underpriced Bestsellers & Weak Price Architecture
What it looks like:
- Your bestsellers are priced like average items.
- Little or no premium steps (no “good / better / best” price ladder).
- Fear of price increases because “customers will leave.” That fear is happening alongside heightened value-consciousness in 2026, according to McKinsey.
Why it kills your profit:
- You leave money on the table every time a guest orders your signature items.
- You don’t anchor value with higher-priced options, so guests trade down.
- Small margin gap between low and high items equals weak check averages.
In our data, when restaurants strategically raised prices on their top 10 sellers by 5–10%, most saw no meaningful drop in volume, but achieved boost in profit margin on those items.
How to fix it:
- List your top 10–15 bestsellers by volume.
- Check food cost % for each.
- Increase prices first on:
- Signature dishes
- High-value perceived items
- Items with strong reviews / loyalty
- Build a simple “good / better / best” structure in each category.
Killer #3: Zero Recipe Discipline & Portion Control
What it looks like:
- Cooks often eyeball portions.
- Recipes exist “somewhere,” but nobody follows them.
- Food cost swings 3–6 points from month to month with no clear reason.
Why it kills your profit:
- Over-portioning quietly destroys margins.
- Inconsistent dishes lead to lower perceived value and more comps.
- You can’t manage what you can’t measure.
We’ve seen 5–10% of food cost drop back to the bottom line just by standardizing recipes and enforcing portion tools.
How to fix it:
- Standardize recipes for your top 20 dishes first.
- Use scales, scoops, ladles, and portion tools — not “feel.”
- Train shift leads to spot-check portions during service.
- Do a weekly food cost review by category, not just once a month.
Killer #4: Reactive, Gut-Based Labor Scheduling
What it looks like:
- Schedules based on “what we did last week” or “what feels safe.”
- Same number of people on slow Monday as on busy Thursday.
- No link between expected covers and planned labor hours.
Why it kills your profit:
- Overstaffing eats margin on quiet shifts. The goal isn’t just cutting hours — it’s learning how to reduce operating expenses without hurting service.
- Understaffing kills service on busy shifts and cuts repeat visits.
- Labor turns into a constant panic instead of a planned investment and the hidden cost of chaotic scheduling is showing up in operator playbooks, according to QSR Web.
Across the 3,500+ units we studied, restaurants with data-based scheduling (labor tied to forecasted sales) ran labor 2–4 points lower without hurting guest satisfaction.
How to fix it:
- Look at sales and covers by day and hour for the last 8–12 weeks.
- Set a target like:
- “We want X covers per labor hour in each daypart.”
- Build your schedule around the forecast, not feelings.
- Review weekly: where were we over? where were we short? adjust.
Killer #5: Slow Guest Flow & Weak Throughput
What it looks like:
- Bottlenecks at host stand, bar, or expo.
- Long ticket times at peak.
- Tables sitting dirty while guests wait.
Why it kills your profit:
- Fewer guests per hour per seat.
- More staff needed to handle the same volume.
- Marketing brings people in, but your system can’t handle them efficiently.
We’ve seen restaurants increase revenue by 15–25% with the same foot traffic just by improving throughput and table turns.
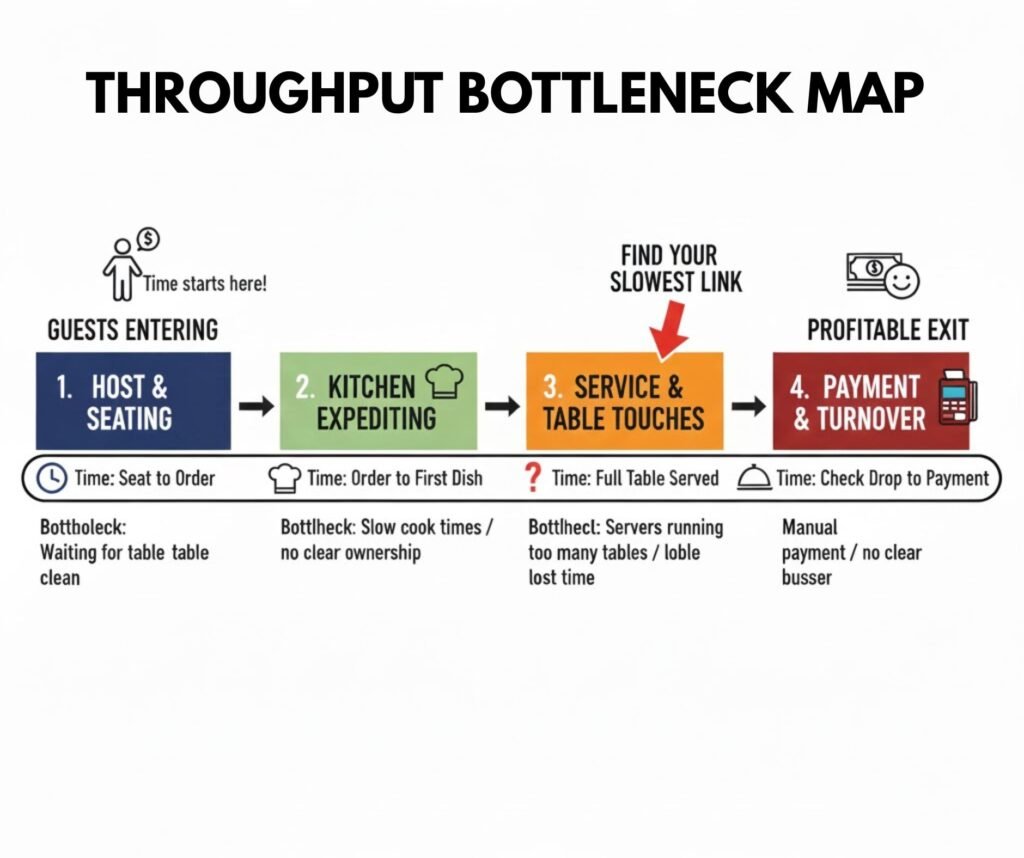
How to fix it:
- Time your operation at peak:
- Seat to order
- Order to first item
- First item to full table served
- Check drop to payment
- Find the slowest link (kitchen, expo, server steps, payment).
- Change layout, steps of service, or staffing targeted at that bottleneck.
- Train one simple “peak playbook” so the team knows exactly how to run rush.
Killer #6: Unprofitable Third-Party Delivery & Channel Mix
What it looks like:
- Heavy reliance on delivery apps.
- Same menu prices on delivery as dine-in.
- No clear view of channel-level profitability.
Why it kills your profit:
- Commissions + higher packaging + slower kitchen equal thin or negative margins.
- Kitchen gets clogged with low-margin orders while dine-in suffers.
- You chase sales instead of profitable sales. Most consumers prefer ordering directly from restaurants according to Restaurant Dive.
How to fix it:
- Calculate true margin per channel (dine-in, takeout, delivery).
- Increase delivery prices and/or create delivery-only bundles with better margins.
- Limit delivery menu to high-margin, travel-safe items.
- Protect kitchen capacity during peak dine-in hours.
Killer #7: Keeping “Pet” Dishes That Lose Money
What it looks like:
- Items that barely sell but the owner or chef loves them.
- Dishes with low or negative contribution margin.
- “We can’t remove it, a few people always order it.”
Why it kills your profit:
- Ties up SKUs, labor, and mental space.
- Adds complexity without adding enough profit.
- Confuses your positioning and slows the line.
How to fix it:
- List all items with low sales + low margin.
- Ask: does this dish:
- Define our brand?
- Drive high-value traffic?
- Have a plan to grow sales?
- If not, cut it or re-engineer it to hit your target margin.
- Remember: you are not your menu. Your menu is a profit tool.
Killer #8: No Clear Prime Cost Guardrails
What it looks like:
- Owner checks P&L once a month and panics.
- No weekly targets for food & labor combined (prime cost).
- Staff doesn’t know what “good” looks like.
Why it kills profit:
- Drift happens. Food and labor slowly creep up.
- You only react when the month is already gone.
- No accountability, no rhythm.
Our experience shows that restaurants that set weekly prime cost targets and track them run far more stable margins and can actually predict their profit.
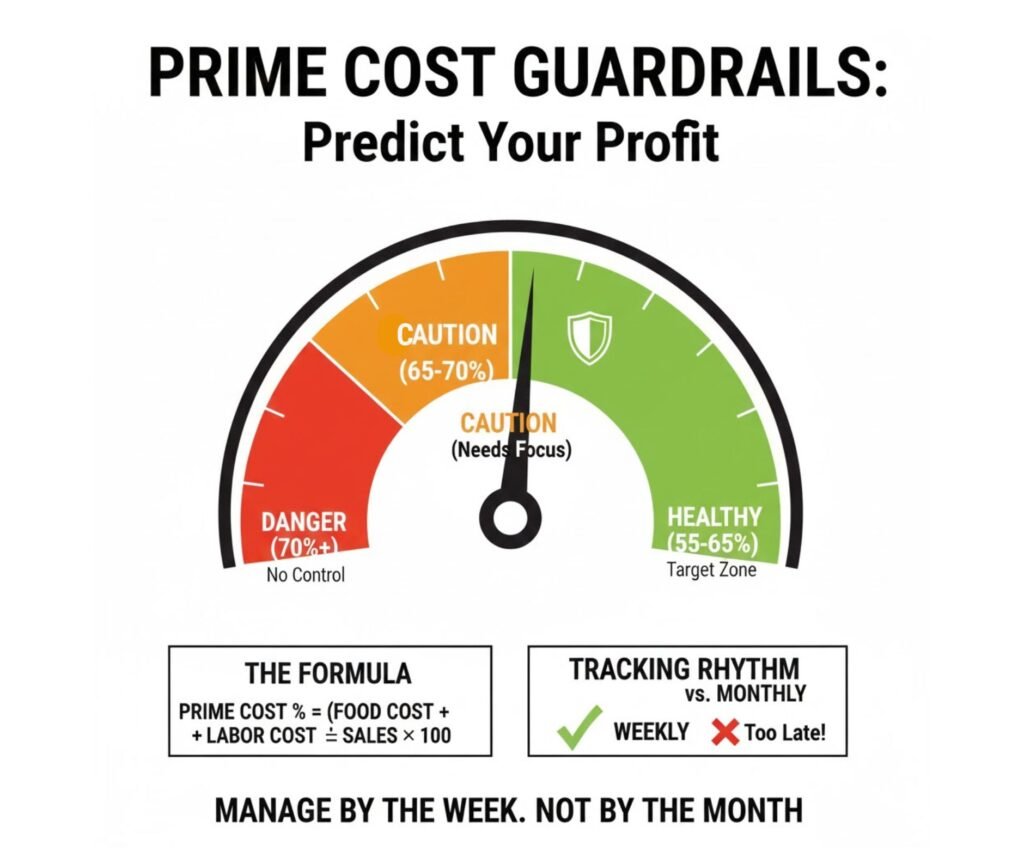
How to fix it:
- Set your target:
- Prime Cost % = Food Cost % + Labor %
- Many healthy restaurants aim for 55–65%, depending on concept.
- Track it weekly, not just monthly.
- When prime cost is off, ask:
- Was it sales volume?
- Food waste / over-portioning?
- Labor scheduling?
- Fix the root, not just the number.
CASE STUDY: A REAL EXAMPLE (COMPOSITE FROM A NATIONAL BRAND-STYLE GRILL)
Restaurant Type: Casual dining grill & bar
Location: Suburban, U.S.
Seats: 150
Starting Point:
- Sales: $130,000/month
- Food Cost: 33–35% (bouncing)
- Labor: 33–36%
- Prime Cost: 66–71%
- Net Profit: ~3–4%
Main Problems Identified (Margin Killers Present):
- Bloated menu – 82 food items, many low sellers.
- Underpriced bestsellers – signature burger and ribs priced low vs local peers.
- No portion control – cooks eyeballing, no scales used.
- Gut-based labor – same schedule every week.
- Slow flow at peak – ticket times >25 minutes on Fridays.
- Delivery menu same as full menu at dine-in prices.
- Multiple “pet dishes” with low margin and low sales.
- No weekly prime cost target or tracking.
What Was Implemented (Based on the Restaurant Revenue Growth Engine™):
- Menu Simplification (Factor: Menu Simplicity / Focus)
- Cut 24 low-selling items.
- Trimmed SKUs and prep methods.
- Price Power & Architecture (Factor: Price Level Optimization)
- Raised prices 6–12% on top 10 bestsellers.
- Introduced clear “good / better / best” price ladders.
- Recipe & Portion Discipline (Factor: Operational Simplicity)
- Standardized recipes for top 25 dishes.
- Added scales and portion tools; daily spot-checks.
- Labor Scheduling by Forecast (Factor: Operational Simplicity)
- Built schedules off 12-week sales patterns.
- Reduced labor hours on slow days, reallocated to peak.
- Throughput & Floor Flow (Factor: Operational Simplicity)
- Simplified expo line.
- Adjusted server sections to reduce “dead corners.”
- Tight peak playbook.
- Channel Mix & Delivery (Factor: Price Level Optimization)
- Reduced delivery menu to 25 high-margin items.
- Increased delivery prices.
- Blocked delivery during peak 90-minute window on Friday/Saturday.
- Prime Cost Guardrails (Factor: Operationa
l Simplicity) - Set weekly prime cost target at 62%.
- Tracked food + labor every week with managers.
Results After 90 Days:
- Food Cost: down from 33–35% to 29–30%
- Labor: down from 33–36% to 30–32%
- Prime Cost: down from 66–71% to 59–62%
- Net Profit: up from 3–4% to 10–12%
- Guests per hour: up ~15% at peak with similar staffing
None of this came from going viral or inventing something new. Just removing eight quiet margin killers that were draining the business.
KEY MISTAKES: WHAT TO AVOID
These are the mistakes we see operators make again and again. Let’s hit the traps head-on — so you don’t pay for them later.
- Trying to grow sales before fixing margins.
More broken sales equals more broken profit. - Scheduling based on gut instead of forecast.
“Feels right” is not a labor strategy. - Letting staff eyeball portions.
If it’s not measured, it’s leaking money. - Keeping low-margin dishes because “customers like them.”
If they like them so much, they’ll buy the re-engineered version with healthy margin. - Assuming more customers automatically means more profit.
If your margin model is broken, more volume can make you busier and poorer. - Relying on marketing to cover operational gaps.
Ads don’t fix a menu that doesn’t make money.
METRICS: THE NUMBERS THAT MATTER
You don’t need 40 KPIs. Start with these metrics — they map directly to the restaurant profitability formula every owner should understand before trying to “grow their way out” of margin pressure.
-
Food Cost %
Food Cost % = (Food COGS / Food Sales) × 100
-
Labor Productivity
Labor Productivity = Covers / Labor Hours
-
Contribution Margin (per dish)
Contribution Margin = Selling Price – Cost per Dish
-
Prime Cost %
Prime Cost % = (Food COGS + Labor Cost) / Total Sales × 100
-
Throughput (Guests per Hour)
Throughput = Guests Served / Hours (per station or per line)
-
Net Profit Margin
Net Profit Margin = Net Profit / Total Sales × 100
Track these weekly. Not once a quarter. Weekly is where control lives.
MAKE IT STICK: THIS IS YOUR MARGIN FIXER CHECKLIST
Run this checklist every month (or faster):
- Have we removed or re-engineered low-selling, low-margin items?
- Are top 10–15 bestsellers priced and engineered for profit?
- Do we have written recipes and portion tools in daily use?
- Is labor scheduled off forecasted sales, not just “what we did last week”?
- Have we measured ticket times and throughput at peak in the last 30 days?
- Do we know channel-level profitability (dine-in vs takeout vs delivery)?
- Have we cut “pet dishes” that don’t earn their place on the menu?
- Do we have a weekly prime cost target and review rhythm?
If you can’t check most of these, you don’t need more hustle. You need a cleaner system.
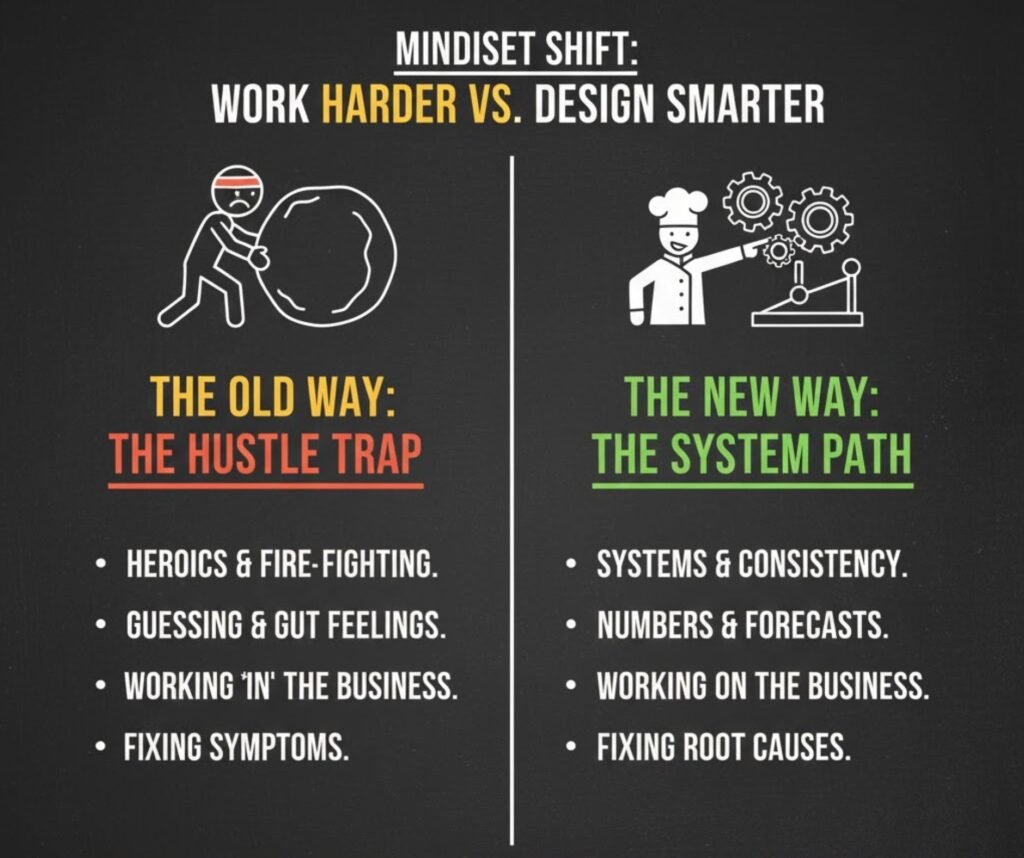
THE SHIFT YOU NEED TO MAKE
A few simple belief shifts:
- You don’t win by working harder. You win by removing chaos.
- Systems beat talent. A good system makes average people perform well.
- Numbers beat guessing. Feelings won’t pay vendors.
- Consistency beats effort. Doing the right things weekly beats heroics.
Stop asking, “How do I get more customers?” Start asking first, “How do I keep more profit from the customers I already have?”
ACTION PLAN: WHAT TO DO NEXT
Here’s your quick action plan. Do this for the next few weeks and you’ll see the numbers move:
- Run a simple profit scan.
- Pull last 3 months of P&L.
- Note Food %, Labor %, Prime Cost %, and Net Profit Margin.
- Identify your killers.
- Use the 8 killers list.
- Circle the 3 that are clearly true for your restaurant.
- Fix in order, not at random.
- Start with menu + pricing + portion control (Food).
- Then fix labor scheduling and throughput (Labor).
- Then fix channel mix and pet dishes.
- Set weekly guardrails.
- Define your target prime cost.
- Review food + labor weekly with your managers.
FREQUENTLY ASKED QUESTIONS (FAQ)
Q1: What is a “good” profit margin for a restaurant?
It varies by concept, but many healthy restaurants aim for 10–20% net profit after all expenses. If you want a clearer benchmark range by restaurant type, see our guide to average restaurant profit margin targets. The key is not chasing an exact number at first, but improving your margin trend month over month.
Q2: Should I raise prices even if guests are already complaining about costs?
If they’re complaining and you’re still unprofitable, the problem is usually menu structure and perceived value, not just price. Start by fixing weak items, portioning, and presentation — then apply smart, targeted price increases to your bestsellers and premium items.
Q3: How often should I review my prime cost?
Weekly. A monthly review is like reading yesterday’s news. Weekly prime cost tracking lets you correct course before the month is lost.
Q4: Do small restaurants really need this level of system?
Yes. In small restaurants, one bad decision hits harder. You don’t need a big corporate team — just a simple, repeatable way to control the 8 killers.
FINAL THOUGHTS
You’ve just seen 8 of the most common profit margin killers we keep finding across a 3,500-restaurant dataset. None of them are sexy. None of them are trendy. But every single time we remove them in the right order, profit jumps — even when sales stay flat.
These are real plays pulled from real restaurants. They work. But they’re only a small slice of the full system Restaurant Revenue Growth Engine™ that separates predictable, profitable restaurants from the ones that are always one bad month away from trouble.
High-performing operators don’t guess which lever to pull next. They assess, prioritize, and optimize their menu, pricing, labor, throughput, and channel mix as one connected system.
If you want the complete picture — and you want to know which drivers are quietly killing your margins right now — the next step is simple: schedule a free consultation call below.