
Most owners think they have operating expenses problem. What we see, across the thousands of restaurants we’ve analyzed, is almost never that simple.
When we mapped restaurant performance across QSR, fast casual, casual dining, premium casual, and fine dining, a clear pattern showed up: The restaurants that grew year after year weren’t the ones with the lowest costs.They were the ones with the cleanest and most efficient systems. The care they took towards perfecting their system — thier engine of growth and profitabilty — was on a whole other level.
Instead of slashing staff, cutting quality, or bullying suppliers for pennies, they focused on a structured set of revenue and efficiency drivers that shaped:
- Guest perception
- Price power
- Check average
- Throughput
- And yes — operating expenses per dollar of revenue
When multiple drivers improved together, restaurant operating expenses dropped without hurting service. In some units, guest satisfaction actually went up while costs went down.
If you want to know where your hidden leaks really are — and how much money your operation is leaving on the table — the next step is to look at your restaurant like a system, not a spreadsheet. If you want the bigger framework that ties benchmarks, cost targets, and operating systems together, start with our Restaurant Profitability Blueprint.

KEY POINTS: WHAT YOU’LL LEARN
In this article, you’ll see:
- The real problem and 5-step process how to fix it: Learn how to replace chaos with a clean operating system so expenses drop, service improves, and profit becomes predictable.
- Why this matters: Cutting operating expenses the wrong way could hurt service — fix costs the right way so profit rises and the business feels stable.
- Real example of cutting costs while improving service: Copy system changes that cut prime cost nearly 10% while service speed and guest feedback improved.
- Key mistakes to avoid: Cost-cutting moves that create chaos, slow service, and lock in long-term profit leaks.
- The numbers that matter: You don’t have a cost problem — you have a visibility problem. Track a few efficiency metrics and the leaks show up fast. Then you fix them.
- Make it last: Anyone can cut costs once. Simple operating habits lock in the win so costs don’t creep back.
- The mindset reset you need: Don’t focus on cutting random costs. Real profit comes from a cleaner system: less friction, less waste, more output with the same labor.
- What to do next: Run a tight 30-day action plan — reduce operating expenses without hurting service, and put profit back under your control.
WHY THIS MATTERS
Let’s be direct. Food costs are up as shown in USDA ERS Food Price Outlook. Labor is also up as reflected in U.S. Bureau of Labor Statistics (BLS) Report. Guests are pickier. Delivery commissions eat margins. In this world, “we’ll just raise prices” is not a strategy. It’s a delay. And if you’ve felt like volume is rising but the bank account isn’t, it’s usually because sales are up but profits aren’t for reasons that have nothing to do with “one more promo” and everything to do with the system underneath.
Here’s what top performing brands quietly do instead:
- Chipotle simplifies menu and builds operations so one line can push serious volume with relatively few SKUs. The company has publicly discussed throughput-focused kitchen upgrades in Restaurant Business.
- In-N-Out runs a tiny menu, insanely tight systems, and keeps throughput high — labor per dollar of sales stays lean.
- Chick-fil-A invests heavily in training and process — longer lines, but fast-moving and high check averages.
These brands aren’t guessing. They understand the value of operational productivity — especially investing in frontline talent (McKinsey talks about this). That’s why they design their operating model so costs are naturally lower per dollar of revenue.
That’s the part most independents miss: good food doesn’t guarantee profit if the menu, labor model, and flow are quietly multiplying waste behind the scenes.
Here’s what we see owners doing all the time:
- Cut hours randomly
- Drop another % off food cost by squeezing suppliers
- Add more menu items hoping to attract “everyone”
- Throw more bodies on busy shifts instead of fixing flow
That usually ends the same way: stressed staff, slower service, more mistakes, higher comps, and guests who never come back.
This article matters because:
- You don’t need to “hurt service” to cut costs.
- You need to stop paying for chaos.
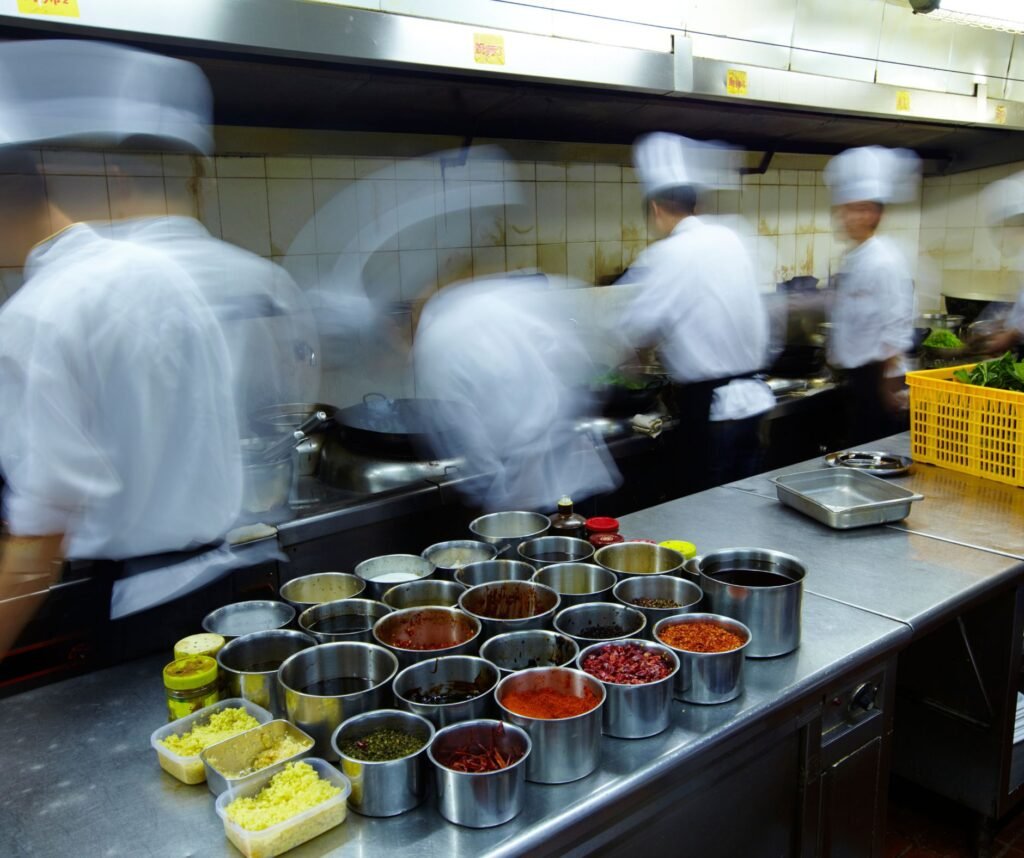
REAL PROBLEM AND STEP-BY-STEP HOW TO REDUCE OPERATING EXPENSES WITHOUT HURTING SERVICE
The real problem, as you’ve already seen, isn’t that restaurants “spend too much”— it’s that the operation is messy. A bloated menu, slow stations, schedules made on gut feel, and no clear standards create waste… lots of waste. That’s why cutting costs the usual way (cutting staff, cheaper ingredients, squeezing vendors) often backfires — service slows down, quality slips, sales drop, and profit still doesn’t improve. The better move is to clean up the system so every shift runs smoother, costs fall naturally, and guests still get great service.
Here is our simple but highly effective 5-step process to reduce costs without hurting operations and customer experience:
Step 1: Stop Looking at Your Total Costs — Start Looking at Cost per Dollar of Sales
The question you should ask yourself isn’t “How big is my expense number?” The real question is “How much does it cost me to generate $1 of sales?”
Key mindset: If sales are messy and inefficient, your cost per $1 stays high, even if the total number looks “okay”.
Look at:
- Labor cost % of sales
- Prime cost % (Food + Labor)
- Operating expenses per $1 of sales (rent, utilities, etc. included)
If you’re unsure what “good” actually looks like for your concept, sanity-check your numbers against the average restaurant profit margin benchmarks before you start making changes.
Among restaurants we’ve worked with that were “overstaffed,” about 60% didn’t actually have a labor problem — they had a throughput and menu problem. Once flow improved, labor cost % dropped without layoffs.
Recommended Action:
Pull the last 3 months:
- Labor % by week
- Food cost % by week
- Prime cost % by week
This is your starting point.
Step 2: Simplify the Menu to Reduce Hidden Complexity
Operating expenses are heavily driven by complexity:
- When you add more menu items, you need more work to prep food, more space to store it, and more training for your team. You also waste more food. And when food prices go up (CPI for Food reported on FRED), that waste hits your profit hard and starts draining your money.
- More “special” dishes lead to more errors, slower kitchen, more comps
- More modifiers result in more time at POS and more ticket mistakes
In our data, restaurants that cut their menu by 25–35% (eliminating low-margin, low-volume items) typically saw:
- Food waste down 15–20%
- Prep hours down 10–20%
- Ticket times down 5–15% in busy periods
And guest satisfaction stayed flat or improved.
How to do it? Here’s the fair-and-square mini method that actually works:
- Pull item-level sales for 90 days.
- Label every item:
- A: High volume, high margin — keep
- B: High volume, low margin — re-engineer price/portion
- C: Low volume, high margin — maybe keep 1–2 as “heroes”
- D: Low volume, low margin — kill
- Remove D’s. Aggressively. No nostalgia.
- For each removal, check:
- How many ingredients disappear?
- How much prep does it save?
- Does it simplify training?
Your goal: Fewer items, more repetition, smoother line.
Step 3: Redesign Shifts Around Throughput, Not “Coverage”
Most restaurants schedule like this: “Friday is busy, let’s put more people on.”
High-performing operators schedule like this: “What’s our main throughput bottleneck, and how many people do we need exactly there?”
Throughput = guests served per hour per station.
Common bottlenecks:
- Expo / pass
- Grill or fry station
- Bar (for full-service)
- Host / seating
- Cashier / POS for QSR
When a bottleneck is jammed, everyone looks busy, but the restaurant is bleeding:
- Longer ticket times lead to more comps, more walkouts
- Stressed staff results in higher mistakes, lower upselling
- Guests feel “bad service” even with a full crew on the floor
What we’ve seen:
- Restaurants that reallocated existing hours to bottlenecks (and cut excess from non-bottleneck roles) reduced labor cost per $ of sales by 10–15% without changing total hours. Efficiency-led labor strategies are an indispensable part of chain playbooks. See how Shake Shack plans to win market share in 2026, as reported by Restaurant Business.
How to do it:
- Map your rush. Take a busy Friday/Saturday and write:
- 15-minute intervals, number of guests seated / orders taken
- Ticket times
- Where things slowed: kitchen? bar? host? POS?
- Mark the bottleneck. If 20 tickets are waiting at grill, that’s it. If guests wait 15 minutes to order while tables are empty, POS is the bottleneck.
- Rebuild schedule around bottlenecks.
- Put your best people at the bottleneck during rush
- Move weaker staff to roles that don’t control flow
- Trim hours in roles that are “nice to have” but don’t impact throughput
This keeps service speed high while removing wasteful labor.
Step 4: Standardize Tasks So You Don’t Pay for Chaos
Understand, high expenses hide in small inconsistent tasks:
- Prep taking “as long as it takes”
- Servers closing in their own way
- Managers reinventing checklists every night
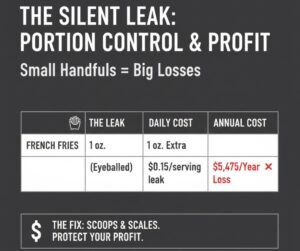
- Cooks eyeballing portions
In our dataset, restaurants that implemented tight task standards and portion control (for example, moving from hand-scooped fries to pre-weighed portions) saw:
- COGS improvement of 2–4 points
- Labor savings of 8–10% on prep and closing shifts
Key moves:
- Write clear task standards for:
- Opening and closing
- Prep (what, how much, by when)
- Line setup and breakdown
- Cleaning
- Turn them into checklists.
- Assign ownership (“Line cook A”, “Server B”)
- Time-box tasks (“15 minutes for station setup”)
- Portion control.
- Use scoops, ladles, scales for high-cost items
- Standardize plate builds with photos
- Train: “This is the only way we plate this dish.”
This doesn’t slow service — it speeds it up and makes costs predictable.
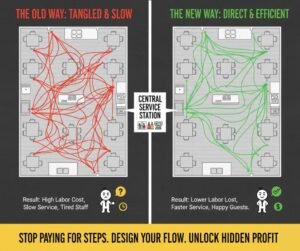
Step 5: Fix Your Seating and Flow Before You Cut Staff
A lot of “service problems” come from bad layout and flow, not lack of people.
We’ve seen cases where:
- One extra POS terminal reduced lines and allowed the restaurant to cut 10–15 front-of-house hours per week without touching service.
- Adding a simple “runner” station near the dining room cut server steps by 20–30% and made it possible to reduce one server per shift with no impact on guest experience.
Look for:
- Long walks: server walks 20 steps for straws, 30 for sauces
- Single points of failure: one POS, one printer, one expo
- Back-and-forth: staff crossing paths constantly
Simple fixes:
- Add a small service station with the top 10 items staff grab
- Reposition POS to reduce walking time
- Move trash/dirty dish drop to logical traffic points
You’re not cutting service — you’re removing wasted motion so fewer people can deliver better service.
CASE STUDY: CUTTING COSTS WHILE IMPROVING SERVICE
Restaurant Type: Casual dining, modern American
Location: Suburban Midwest
Seats: 120
Problem Identified:
- Labor at 36–38% of sales
- Food cost at 32–34%
- Prime cost hovering around 70%. Owner believed: “We’re just overstaffed and food prices are killing us.”
What Was Implemented (90-Day Plan)
- Menu Simplification
- 84 items → 56 items (33% reduction)
- Removed 19 low-volume, low-margin dishes
- Cut 22 ingredients from purchasing list
- Shift Rebuild Around Bottlenecks
- Identified grill and expo as bottlenecks on Friday/Saturday
- Moved one server to running/expediting during peak instead of adding another cook
- Cut one server position on slower midweek lunches
- Task Standards + Portion Control
- Standardized prep quantities by daypart
- Introduced portion scoops for proteins and sides
- Implemented closing checklist with time targets
- Flow Tweaks
- Added a mini service station in the middle of the dining room
- Moved POS from far wall to central spot
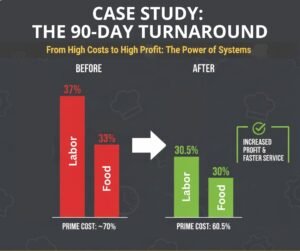
Results After 90 Days
- Labor %: Down from 37% to 30.5%
- Food Cost %: Down from 33% to 30%
- Prime Cost: Down from ~70% to ~60.5%
- Ticket Times:
- Dinner peak: 22 minutes → 17 minutes average
- Guest Feedback:
- Online reviews mentioned “faster” and “more attentive” service more often
- No meaningful dip in review scores after menu cuts
And all of these achieved with zero layoffs and no slash-and-burn. Just implementing systems that do all the heavy lifting.
KEY MISTAKES: WHAT TO AVOID
Here are the biggest traps we see when owners try to cut costs — the same profit margin killers that quietly drain restaurants even when sales look “fine.”:
-
Cutting staff first.
You fire people or slash hours before fixing menu and flow. Service drops, mistakes go up, and you lose loyal guests. Costs “drop” on paper but profit (your top KPI) doesn’t improve long term.
-
Ignoring menu complexity.
Keeping 100 items “because regulars like them” while your kitchen dies in the weeds. You pay in prep, waste, training, and slower service.
-
Scheduling by gut.
“Feels like a busy Friday, throw more people on.” You’re paying for comfort, not productivity.
-
Letting staff eyeball everything.
A “little extra” on every plate becomes thousands per month. Nobody can manage food cost that way.
-
Assuming more customers automatically means more profit.
If your system is messy, more volume just multiplies your problems. You can be packed and still broke.
-
Using marketing to cover operational leaks.
Bringing in more guests before you fix ticket times, quality, and consistency just accelerates churn.
METRICS: THE NUMBERS THAT MATTER
Before you track anything, make sure your team is aligned on the restaurant profitability formula — otherwise you’ll measure activity instead of progress. If you want to cut expenses without hurting service, track these:
Food Cost %
Food Cost % = (Cost of Food / Food Sales) × 100
Labor Cost %
Labor Cost % = (Total Labor Costs / Total Sales) × 100
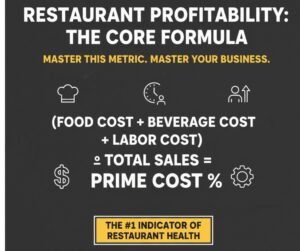
Prime Cost %
Prime Cost % = (Food Costs + Beverage Costs + Labor Costs) / Total Sales × 100
Labor Productivity (Covers per Labor Hour)
Throughput
Waste % (by category)
Waste % = (Value of Waste ÷ Total Purchased) × 100
Watch these weekly. Focus on trends, not single days.
MAKE IT LAST: YOUR SIMPLE RESTAURANT OPERATING EXPENSES CHECKLIST
Use this as a quick monthly audit:
Menu
- We’ve removed low-margin, low-volume dishes
- Every menu item clearly earns its place (margin, volume, or brand “hero”)
- Ingredients list is as short as possible
Labor
- Schedules are built from sales and throughput data, not feelings
- Bottleneck stations during peak are always staffed by top performers
- We track labor % and productivity weekly
Operations
- Prep, opening, and closing use written checklists with time targets
- Portion sizes are controlled by tools (scoops, scales) not guesses
- Staff know the “one right way” to build each dish
Flow
- POS and service stations are placed to minimize walking and crossing paths
- We review flow after peak shifts to remove friction
- Service speed is measured, not guessed
THE SHIFT YOU NEED TO MAKE
What we’ve learned is that you don’t win by squeezing every line item until people hate working for you and guests feel it.
You win by removing chaos. Remember:
- Systems beat talent
- Numbers beat guesses
- Flow beats brute force
- Simplicity beats “more options”
When you think this way, “How do I reduce operating expenses?” becomes: “Where is my system leaking time, food, and energy — and how do I plug that gap once?”
ACTION PLAN: WHAT TO DO NEXT
If you do nothing else, do this in the next 30 days:
-
Run a 90-day menu analysis. Kill the bottom 20–30% of items that don’t earn their spot.
-
Map your peak-hour bottleneck. Rebuild just two key shifts around that bottleneck.
-
Standardize 3 things.
- One prep process
- One portion procedure
- One closing routine
-
Start tracking 3 metrics weekly.
- Labor %
- Food cost %
- Prime cost %
FREQUENTLY ASKED QUESTIONS (FAQ)
Q1: Won’t cutting menu items upset my regulars?
Some might comment, but here’s what we’ve seen: if you keep your core favorites and improve speed and consistency, most guests are happier overall. You’re trading “too many options” for “better execution.”
Q2: How low should my labor % be?
It depends on concept, location, and price point. Instead of chasing a magic number, focus on improving your own baseline by 2–5 points while maintaining or improving guest satisfaction.
Q3: Do I need new software to do this?
Not necessarily—if you’re not in a rush and you’ve got time to test and tweak. But if you want to remove guesswork and get predictable results faster, software helps. Our Restaurant Growth Engine™ is the only tool you need to turn your restaurant into a predictable growth machine—so consistent it feels unfair to competitors.
Q4: How fast will I see results?
We often see first wins (1–3 points off labor or food cost) as early as 30–60 days after menu and schedule changes. Bigger structural improvements (flow, culture, training) compound over 3–6 months.
FINAL THOUGHTS
You’ve just seen a handful of plays we’ve pulled again and again from our extensive dataset — simple moves that cut operating expenses without cutting service:
- Trim the menu
- Fix the bottlenecks
- Standardize the work
- Clean up the flow
Every one of these works. But they’re only a slice of the full 16-factor Restaurant Growth Engine™ system we use to turn “busy but broke” restaurants into predictable profit machines.
The operators who win aren’t the ones who cut deepest. They’re the ones who implement the whole system, identify the real constraint, and fix the right thing in the right order.
If you want to know what is choking your profit — and how much cash you’re leaving on the table each month — your next step is simple: schedule a free consultation below now.