

Every week we talk to many owners who ask the same question in different words: “What should my restaurant profit margin be? Am I doing okay or getting killed and I just don’t know it?”
After analyzing 3,500+ restaurants across QSR, fast casual, casual dining, premium casual, and fine dining, one thing is very clear: profit margin is not a single number you “aim at.” It’s the scoreboard of how your entire system is working.
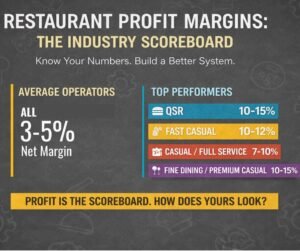
Across the industry, what we’ve obeserved is that most restaurants live in a narrow band of 3–5% net profit margin. Top performers in each segment push that up into the high single digits or teens — and a few giants, like Chipotle, Shake Shack, Taco Bell and Chick-fil-A run far above that because their entire system is built for optimizing margin and profit.
What our dataset shows is that the restaurants that win don’t “grind harder.” They:
- Know very well their segment benchmarks
- Consistently track a small set of core numbers (prime cost, revenue per seat per hour, contribution margin)
- Relentlessly focus on fix systemic bottlenecks instead of patching symptoms
Among the 620 restaurants we studied that moved from under 5% to over 10%+ net margin, none did it from “cost cuts only.” Every single one improved both: (1) margin on each sale and (2) revenue per seat per hour. If you want the full profitability framework behind the numbers, start with our restaurant profitability blueprint.
Use this article as your lens, then get an evaluation (below) to see how well you’re using the same growth drivers top brands rely on — and how much money you may be leaving on the table right now.

KEY POINTS: WHAT YOU’LL LEARN
By the end of this article, you’ll know:
- How to improve restaurant profit margins: Turn your numbers into a clear plan that lifts margin and makes profit predictable.
- Why it matters: So your restaurant makes real money and isn’t one bad month away from trouble.
- Real example: Apply the same system principles to reach double-digit margins without becoming a big brand.
- Key mistakes to avoid: Don’t make moves that lock in leaks and keep you working harder for the same money.
- How to make it last: Lock in simple habits so margin gains hold and profit stays consistent.
- The shift of mind you need to make: Run on systems and numbers—not guessing—so profit becomes predictable.
- Action plan: A 30-day reset to lift margins and make profit predictable.

WHY THIS MATTERS
Let’s be straight.
Most owners are flying blind. They see:
- Food costs up
- Labor up
- Rent fixed
- Delivery apps taking a cut making profitability challenging when commissions hit 20–30%, as reported by Restaurant Dive
…so they just feel stuck, ignore the restaurant profitability formula, and just hope for “more volume.”
Our data says the average restaurant lives around 3–5% net profit. That unfortunately means one bad month, one equipment failure, one staffing mistake can bring a lot of volatility to your operations and can wipe out your entire year.
Meanwhile:
- QSRs on average get around 5-9% net profit margin
- Fast casual often sit in the 2–6% range
- Full-service / casual dining usually land around 3–6%
- Fine dining that’s dialed-in can hit 6–8%
Top brands:
- Five Guys net margin runs arround 19%
- Chipotle’s restaurant-level net margin hovers arround 25%
- Pizza Hut achieves net margins of 16-20%
But here’s the key: they aren’t getting those margins from “one magic trick.” They run a system – building a simple menu, tight operations, tech, and pricing power into the DNA of the business. The broader turnaround theme has been covered by Nation’s Restaurant News.
This article matters now because:
- Costs are up, guests are more price-sensitive as shown by McKinsey report, and single-digit margins give you no safety.
- You can’t copy top performers’ numbers, but you can copy how they thinkabout margin.
STEP-BY-STEP: HOW TO IMPROVE RESTAURANT PROFIT MARGIN (THE PROFIT STACK METHOD™)
We use a simple 5-step flow with clients.
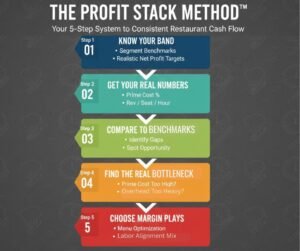
Step 1: Know Your Segment’s Target Band
First, you need to realize that “good food” doesn’t guarantee profit and stop chasing some random numbers you have in your head.
Start using these realistic net profit bands as your starting point (after paying yourself a market-rate salary):
- QSR: 7–10% good, 10%+ strong
- Fast Casual: 5–10% good, 10%+ strong
- Casual / Full Service: 5–7% good, 7%+ strong
- Fine Dining / Premium Casual: 7–10% good, 10%+ strong
In our restaurant dataset, roughly 18% of units operate above their segment “strong” band. Almost all of them score high in three factors:
- Prime Cost Control
- Menu Simplicity
- Capacity & Throughput
Step 2: Get Your Real Numbers (No Guessing)
You need four simple calculations:
- Net Profit Margin
- Prime Cost = Cost of Goods Sold (COGS) + Labor Cost
- Prime Cost % = (COGS + Labor) ÷ Total Sales × 100
- Revenue per Seat per Hour = Total Revenue ÷ (Number of Seats × Operating Hours)
We’ve seen many operators that are not cerain about the key performance indicators that drive their margins. If you can’t pull these from last month, that’s your first problem — not your “marketing.”
Step 3: Compare to Benchmarks
From our data, healthy ranges are as follows:
- Prime Cost %
- QSR / Fast Casual: 55–60%
- Casual / Full Service: 60–65%
- Fine Dining: 60–68% (higher labor, higher check)

- Revenue per Seat per Hour
- QSR: $10–$15
- Full-service restaurants: $6–$9
When we looked at restaurants with net margin under 5%, 73% had prime cost >5 percentage points above their segment’s healthy range and revenue per seat per hour below the median. They didn’t have a “profit problem.” They had a math problem.
Step 4: Find the Real Bottleneck
Most operators jump straight to “cut staff” or “raise prices.”
Instead, before jumping to such conclusions ask yourself three key questions:
- Is my Prime Cost % too high?
- If yes, your menu, recipes, and scheduling are most likely the issue.
- Is my Revenue per Seat per Hour too low?
- If yes, you have a throughput / demand / check size issue.
- Is my Overhead Load too heavy?
- Rent, debt, and bloated management structure.
We score these inside the Restaurant Revenue Power Evaluator™. In struggling restaurants:
- 81% of low-margin units scored 1 or 2 (out of 5) on Factor 3: Menu Simplicity
- 69% scored low on Factor 7: Price Level Optimization (too much low-margin delivery, or price levels not optimized in order to capture higher margins).
Step 5: Choose Profit Margin Plays in the Right Order
You don’t need 20 different ideas. You need only 3–5 key plays in a sequence:
- Menu Simplification + Price Level Optimization (Reprice) for Contribution Margin
- Cut bottom 20–30% of SKUs that sell poorly and carry weak margin.
- Re-engineer top sellers to add $1–3 of contribution margin.
- Labor & Prep Aligned to Sales Pattern — this is one of the cleanest ways to reduce operating expenses without hurting service because you’re redesigning labor around demand instead of cutting blindly.
- Schedule to labor productivity (covers or orders per labor hour), not to “vibes.” For the scheduling/compliance angle, see analysis from QSR Web.
- Consolidate prep so your heaviest labor lands closest to peak revenue.
- Channel Mix Clean-Up
- Shift guests from high-fee third-party to your own channels.
- Use promotions on your ordering channels, not on third-party sites. Utilize promotions to capture high level margins from orders sources through third-party sites.
- Raise Throughput, Not Just Prices
- Simplify your line setup.
- Remove slow, high-complexity dishes that block the pass. Big brands’ missteps show how complexity erodes margins, per Restaurant Dive.
- Add one or two “fast fire” high-margin items.
For units that applied this order, we’ve witnessed prime cost dropping 3–7 percentage points and net margin increasing 4.2 points on average in 6–9 months — without cutting opening hours or “crushing” the team.
CASE STUDY: WHAT GOOD PROFIT MARGIN LOOKS LIKE
Restaurant Type: Fast Casual, Mexican
Location: U.S. national brand (Chipotle example as public benchmark)
Seats: Varies, but typical fast casual footprint
Chipotle isn’t one of our clients, but its public numbers are useful as a “what’s possible” benchmark.
- Recent filings show restaurant-level operating margins around 27%
What they’ve built into the system:
- Menu Simplicity: Small core menu, repeatable builds
- Strong Contribution Margins: Price points that support high restaurant-level margin
- Throughput Focus: Line built for speed at peak
- Channel Strategy: Digital + in-store designed to keep operations efficient
Now, compare that to an independent fast casual we analyzed (similar concept, 60 seats, urban location):
- Net margin: 3.8%
- Prime cost: 66%
- Menu items: 74
- 3rd party delivery: 32% of orders, low margin
Action steps taken:
1. Cut SKUs from 74 → 48
2. Re-priced 12 best-sellers to add $1–2 contribution each
3. Moved 15% of third-party volume to direct online ordering
4. Redesigned schedule to target 18–20 orders per labor hour at lunch
Results (12 months):
- Net margin: 3.8% → 10.9%
- Prime cost: 66% → 59%
- Revenue per seat per hour at lunch: $7.20 → $11.40
They have not “become Chipotle.” They’ve just copied the principles: simpler menu, higher contribution margin, better channel mix, better throughput.
KEY MISTAKES TO AVOID
Here’s where we see restaurants burn profit:
-
Treating margin as a “nice to have” instead of a non-negotiable scoreboard.
-
Chasing volume with discounting
- “We’ll make it up in volume” usually means, “We’ll lose money faster.”
-
Cutting labor blindly
- You save payroll but destroy throughput and guest experience which ultimately has a long-term negative effect on your business.
- In our data, restaurants that cut labor without redesigning systems saw average check times increase 18–25%, which hit revenue harder than the labor “savings.”
-
Keeping low-margin “pets” on the menu
- “But customers like it.” Do they order it enough? Does it actually pay rent? Remember: you can’t succeed without strategy and focus—and that includes knowing exactly what not to do.
-
Relying on delivery for profit
- Third-party can be a marketing and volume tool, but treating it as a margin tool is how you end up working for that third-party app
-
Not paying yourself and calling what’s left ‘profit’
- If you don’t include your own market-rate salary—we see this happening all the time—your margin number is a fantasy.
If you want a quick diagnostic list to compare against your own operation, review the most common profit margin killers.
HOW TO MAKE IT STICK (YOUR OPERATIONAL CHECKLIST)
Use this as a quick weekly/monthly check. Stick with it consistently and your margins will start improving sooner than you think:
- I know my segment benchmark for net margin.
- I calculate net margin, prime cost, and labor productivity at least monthly.
- I’ve mapped my top 20 dishes by profit, not just popularity.
- I’ve cut or reworked low-margin, low-volume items.
- Schedules are built from forecasted sales and productivity targets, not gut feel.
- I know my revenue per seat per hour at lunch and dinner.
- I know what % of sales comes through third-party vs direct.
- I’ve set a 12-month net margin target that matches my segment and model.
- I have 3–5 specific plays running right now to close the gap.
THE SHIFT YOU NEED TO MAKE
Here are a few short truths from the many lessons we’ve learned:
- Remember, you don’t win by pushing harder. You win by removing chaos.
- Systems always beat talent. A mediocre team in a great system outperforms rockstars in chaos.
- Numbers beat guessing. Feelings won’t pay your rent.
- Consistency is power and it beats effort. Doing the right things, boring and repeatable, creates margin.
High-margin restaurants aren’t “lucky.” They’re designed for success.
ACTION PLAN: WHAT TO DO NEXT (30 DAYS)
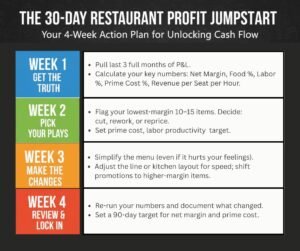
Week 1 – Get the Truth
- Pull last 3 full months of P&L.
- Calculate your key numbers: Net Margin, Food %, Labor %, Prime Cost %, Revenue per Seat per Hour.
- Compare to the benchmark band for your segment.
Week 2 – Pick 3–5 Plays
- Flag your lowest-margin 10–15 items. Decide: cut, rework, or reprice.
- Set a Prime Cost target band based on your segment.
- Set a simple labor productivity target (e.g., 15 orders/hour at lunch).
Week 3 – Make Structural Changes
- Simplify the menu (even if it hurts your feelings).
- Adjust the line or kitchen layout for speed on your top sellers.
- Shift promotions to higher-margin items and to your, not third-party channels.
Week 4 – Review and Lock in
- Re-run your numbers.
- Document what changed.
- Set a 90-day target for net margin and prime cost.
- Decide whether you’ll keep managing this yourself or use the structured Restaurant Revenue Growth Engine™tosave time, cut the guesswork, and do it right.
FREQUENTLY ASKED QUESTIONS (FAQ)
Q1: Is a 20% net profit margin realistic for my restaurant?
For most independent restaurants, no. Can it happen? Yes, in very optimized concepts with strong price power, low overhead, and serious systems. For most operators, a realistic strong band is 8–15%, depending on segment. Aim for “strong for your model,” not “Instagram-flex numbers.”
Q2: Should I focus on cutting costs or growing sales?
Both — but in the right order. That sequencing is the heart of why sales can rise while profits stay flat in the first place. First, fix prime cost and contribution margin so every sale is worth more. Then push volume. Growing low-margin sales usually just means working more for the same money.
Q3: How often should I check my margins?
At least monthly. Top operators report looking at key metrics weekly, even if they only close the full books monthly.
Q4: Can I be “okay” at 3–5% net margin?
You can survive there, but it’s risky. A lease renewal, wage hike, or one bad quarter can wipe you out. Our goal with clients is to move them into the “strong” bandfor their segment so they have real safety and cash to reinvest.
FINAL THOUGHTS
You’ve just seen how margin really works — not as a random number, but as the output of pricing, menu design, cost control, capacity, and channel mix working together.
These are plays pulled from operators who went from “barely paying themselves” to double-digit net margins. Each tactic here works. But it’s still only a small slice of our full systemthat separates predictable, boringly-profitable restaurants from the ones constantly putting out fires.
High-performing restaurants don’t guess which lever to pull:
- They know their true benchmark.
- They measure the right numbers and have a profit optmization system in place.
- They attack the right bottleneck in the right order.
If you want the full system — and you want to see exactly which of the key revenue drivers are capping your margins, profit and growth right now — the next step is simple: schedule a free consultation below now.